[Windows Forms - C# version] NetWinCharts\CSharpWinCharts\glasslightbar.cs
using System;
using ChartDirector;
namespace CSharpChartExplorer
{
public class glasslightbar : DemoModule
{
//Name of demo module
public string getName() { return "Glass Bar Shading"; }
//Number of charts produced in this demo module
public int getNoOfCharts() { return 1; }
//Main code for creating chart.
//Note: the argument chartIndex is unused because this demo only has 1 chart.
public void createChart(WinChartViewer viewer, int chartIndex)
{
// The data for the bar chart
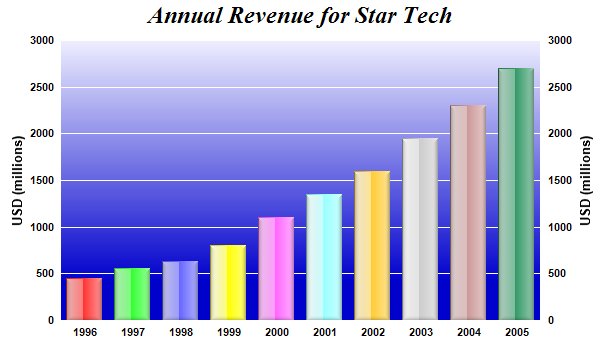
double[] data = {450, 560, 630, 800, 1100, 1350, 1600, 1950, 2300, 2700};
// The labels for the bar chart
string[] labels = {"1996", "1997", "1998", "1999", "2000", "2001", "2002", "2003",
"2004", "2005"};
// Create a XYChart object of size 600 x 360 pixels
XYChart c = new XYChart(600, 360);
// Set the plotarea at (60, 40) and of size 480 x 280 pixels. Use a vertical gradient
// color from light blue (eeeeff) to deep blue (0000cc) as background. Set border and
// grid lines to white (ffffff).
c.setPlotArea(60, 40, 480, 280, c.linearGradientColor(60, 40, 60, 280, 0xeeeeff,
0x0000cc), -1, 0xffffff, 0xffffff);
// Add a title to the chart using 18pt Times Bold Italic font
c.addTitle("Annual Revenue for Star Tech", "Times New Roman Bold Italic", 18);
// Add a multi-color bar chart layer using the supplied data. Use glass lighting effect
// with light direction from the left.
c.addBarLayer3(data).setBorderColor(Chart.Transparent, Chart.glassEffect(
Chart.NormalGlare, Chart.Left));
// Set the x axis labels
c.xAxis().setLabels(labels);
// Show the same scale on the left and right y-axes
c.syncYAxis();
// Set the left y-axis and right y-axis title using 10pt Arial Bold font
c.yAxis().setTitle("USD (millions)", "Arial Bold", 10);
c.yAxis2().setTitle("USD (millions)", "Arial Bold", 10);
// Set all axes to transparent
c.xAxis().setColors(Chart.Transparent);
c.yAxis().setColors(Chart.Transparent);
c.yAxis2().setColors(Chart.Transparent);
// Set the label styles of all axes to 8pt Arial Bold font
c.xAxis().setLabelStyle("Arial Bold", 8);
c.yAxis().setLabelStyle("Arial Bold", 8);
c.yAxis2().setLabelStyle("Arial Bold", 8);
// Output the chart
viewer.Chart = c;
//include tool tip for the chart
viewer.ImageMap = c.getHTMLImageMap("clickable", "",
"title='Year {xLabel}: US$ {value}M'");
}
}
}
[Windows Forms - VB Version] NetWinCharts\VBNetWinCharts\glasslightbar.vb
Imports System
Imports Microsoft.VisualBasic
Imports ChartDirector

Public Class glasslightbar
    Implements DemoModule

    'Name of demo module
    Public Function getName() As String Implements DemoModule.getName
        Return "Glass Bar Shading"
    End Function

    'Number of charts produced in this demo module
    Public Function getNoOfCharts() As Integer Implements DemoModule.getNoOfCharts
        Return 1
    End Function

    'Main code for creating chart.
    'Note: the argument chartIndex is unused because this demo only has 1 chart.
    Public Sub createChart(viewer As WinChartViewer, chartIndex As Integer) _
        Implements DemoModule.createChart

        ' The data for the bar chart
        Dim data() As Double = {450, 560, 630, 800, 1100, 1350, 1600, 1950, 2300, 2700}

        ' The labels for the bar chart
        Dim labels() As String = {"1996", "1997", "1998", "1999", "2000", "2001", "2002", "2003", _
            "2004", "2005"}

        ' Create a XYChart object of size 600 x 360 pixels
        Dim c As XYChart = New XYChart(600, 360)

        ' Set the plotarea at (60, 40) and of size 480 x 280 pixels. Use a vertical gradient color
        ' from light blue (eeeeff) to deep blue (0000cc) as background. Set border and grid lines to
        ' white (ffffff).
        c.setPlotArea(60, 40, 480, 280, c.linearGradientColor(60, 40, 60, 280, &Heeeeff, &H0000cc _
            ), -1, &Hffffff, &Hffffff)

        ' Add a title to the chart using 18pt Times Bold Italic font
        c.addTitle("Annual Revenue for Star Tech", "Times New Roman Bold Italic", 18)

        ' Add a multi-color bar chart layer using the supplied data. Use glass lighting effect with
        ' light direction from the left.
        c.addBarLayer3(data).setBorderColor(Chart.Transparent, Chart.glassEffect( _
            Chart.NormalGlare, Chart.Left))

        ' Set the x axis labels
        c.xAxis().setLabels(labels)

        ' Show the same scale on the left and right y-axes
        c.syncYAxis()

        ' Set the left y-axis and right y-axis title using 10pt Arial Bold font
        c.yAxis().setTitle("USD (millions)", "Arial Bold", 10)
        c.yAxis2().setTitle("USD (millions)", "Arial Bold", 10)

        ' Set all axes to transparent
        c.xAxis().setColors(Chart.Transparent)
        c.yAxis().setColors(Chart.Transparent)
        c.yAxis2().setColors(Chart.Transparent)

        ' Set the label styles of all axes to 8pt Arial Bold font
        c.xAxis().setLabelStyle("Arial Bold", 8)
        c.yAxis().setLabelStyle("Arial Bold", 8)
        c.yAxis2().setLabelStyle("Arial Bold", 8)

        ' Output the chart
        viewer.Chart = c

        'include tool tip for the chart
        viewer.ImageMap = c.getHTMLImageMap("clickable", "", "title='Year {xLabel}: US$ {value}M'")

    End Sub

End Class
[WPF - C#] NetWPFCharts\CSharpWPFCharts\glasslightbar.cs
using System;
using ChartDirector;

namespace CSharpWPFCharts
{
    public class glasslightbar : DemoModule
    {
        //Name of demo module
        public string getName() { return "Glass Bar Shading"; }

        //Number of charts produced in this demo module
        public int getNoOfCharts() { return 1; }

        //Main code for creating chart.
        //Note: the argument chartIndex is unused because this demo only has 1 chart.
        public void createChart(WPFChartViewer viewer, int chartIndex)
        {
            // The data for the bar chart
            double[] data = {450, 560, 630, 800, 1100, 1350, 1600, 1950, 2300, 2700};

            // The labels for the bar chart
            string[] labels = {"1996", "1997", "1998", "1999", "2000", "2001", "2002", "2003",
                "2004", "2005"};

            // Create a XYChart object of size 600 x 360 pixels
            XYChart c = new XYChart(600, 360);

            // Set the plotarea at (60, 40) and of size 480 x 280 pixels. Use a vertical gradient
            // color from light blue (eeeeff) to deep blue (0000cc) as background. Set border and
            // grid lines to white (ffffff).
            c.setPlotArea(60, 40, 480, 280, c.linearGradientColor(60, 40, 60, 280, 0xeeeeff,
                0x0000cc), -1, 0xffffff, 0xffffff);

            // Add a title to the chart using 18pt Times Bold Italic font
            c.addTitle("Annual Revenue for Star Tech", "Times New Roman Bold Italic", 18);

            // Add a multi-color bar chart layer using the supplied data. Use glass lighting effect
            // with light direction from the left.
            c.addBarLayer3(data).setBorderColor(Chart.Transparent, Chart.glassEffect(
                Chart.NormalGlare, Chart.Left));

            // Set the x axis labels
            c.xAxis().setLabels(labels);

            // Show the same scale on the left and right y-axes
            c.syncYAxis();

            // Set the left y-axis and right y-axis title using 10pt Arial Bold font
            c.yAxis().setTitle("USD (millions)", "Arial Bold", 10);
            c.yAxis2().setTitle("USD (millions)", "Arial Bold", 10);

            // Set all axes to transparent
            c.xAxis().setColors(Chart.Transparent);
            c.yAxis().setColors(Chart.Transparent);
            c.yAxis2().setColors(Chart.Transparent);

            // Set the label styles of all axes to 8pt Arial Bold font
            c.xAxis().setLabelStyle("Arial Bold", 8);
            c.yAxis().setLabelStyle("Arial Bold", 8);
            c.yAxis2().setLabelStyle("Arial Bold", 8);

            // Output the chart
            viewer.Chart = c;

            //include tool tip for the chart
            viewer.ImageMap = c.getHTMLImageMap("clickable", "",
                "title='Year {xLabel}: US$ {value}M'");
        }
    }
}
[ASP.NET Web Forms - C# version] NetWebCharts\CSharpASP\glasslightbar.aspx
(Click here on how to convert this code to code-behind style.)<%@ Page Language="C#" Debug="true" %>
<%@ Import Namespace="ChartDirector" %>
<%@ Register TagPrefix="chart" Namespace="ChartDirector" Assembly="netchartdir" %>
<!DOCTYPE html>
<script runat="server">
//
// Page Load event handler
//
protected void Page_Load(object sender, EventArgs e)
{
// The data for the bar chart
double[] data = {450, 560, 630, 800, 1100, 1350, 1600, 1950, 2300, 2700};
// The labels for the bar chart
string[] labels = {"1996", "1997", "1998", "1999", "2000", "2001", "2002", "2003", "2004",
"2005"};
// Create a XYChart object of size 600 x 360 pixels
XYChart c = new XYChart(600, 360);
// Set the plotarea at (60, 40) and of size 480 x 280 pixels. Use a vertical gradient color from
// light blue (eeeeff) to deep blue (0000cc) as background. Set border and grid lines to white
// (ffffff).
c.setPlotArea(60, 40, 480, 280, c.linearGradientColor(60, 40, 60, 280, 0xeeeeff, 0x0000cc), -1,
0xffffff, 0xffffff);
// Add a title to the chart using 18pt Times Bold Italic font
c.addTitle("Annual Revenue for Star Tech", "Times New Roman Bold Italic", 18);
// Add a multi-color bar chart layer using the supplied data. Use glass lighting effect with
// light direction from the left.
c.addBarLayer3(data).setBorderColor(Chart.Transparent, Chart.glassEffect(Chart.NormalGlare,
Chart.Left));
// Set the x axis labels
c.xAxis().setLabels(labels);
// Show the same scale on the left and right y-axes
c.syncYAxis();
// Set the left y-axis and right y-axis title using 10pt Arial Bold font
c.yAxis().setTitle("USD (millions)", "Arial Bold", 10);
c.yAxis2().setTitle("USD (millions)", "Arial Bold", 10);
// Set all axes to transparent
c.xAxis().setColors(Chart.Transparent);
c.yAxis().setColors(Chart.Transparent);
c.yAxis2().setColors(Chart.Transparent);
// Set the label styles of all axes to 8pt Arial Bold font
c.xAxis().setLabelStyle("Arial Bold", 8);
c.yAxis().setLabelStyle("Arial Bold", 8);
c.yAxis2().setLabelStyle("Arial Bold", 8);
// Output the chart
WebChartViewer1.Image = c.makeWebImage(Chart.SVG);
// Include tool tip for the chart
WebChartViewer1.ImageMap = c.getHTMLImageMap("", "", "title='Year {xLabel}: US$ {value}M'");
}
</script>
<html>
<head>
<script type="text/javascript" src="cdjcv.js"></script>
</head>
<body>
<chart:WebChartViewer id="WebChartViewer1" runat="server" />
</body>
</html>
[ASP.NET Web Forms - VB Version] NetWebCharts\VBNetASP\glasslightbar.aspx
(Click here on how to convert this code to code-behind style.)<%@ Page Language="VB" Debug="true" %>
<%@ Import Namespace="ChartDirector" %>
<%@ Register TagPrefix="chart" Namespace="ChartDirector" Assembly="netchartdir" %>
<!DOCTYPE html>
<script runat="server">
'
' Page Load event handler
'
Protected Sub Page_Load(ByVal sender As System.Object, ByVal e As System.EventArgs)
' The data for the bar chart
Dim data() As Double = {450, 560, 630, 800, 1100, 1350, 1600, 1950, 2300, 2700}
' The labels for the bar chart
Dim labels() As String = {"1996", "1997", "1998", "1999", "2000", "2001", "2002", "2003", _
"2004", "2005"}
' Create a XYChart object of size 600 x 360 pixels
Dim c As XYChart = New XYChart(600, 360)
' Set the plotarea at (60, 40) and of size 480 x 280 pixels. Use a vertical gradient color from
' light blue (eeeeff) to deep blue (0000cc) as background. Set border and grid lines to white
' (ffffff).
c.setPlotArea(60, 40, 480, 280, c.linearGradientColor(60, 40, 60, 280, &Heeeeff, &H0000cc), _
-1, &Hffffff, &Hffffff)
' Add a title to the chart using 18pt Times Bold Italic font
c.addTitle("Annual Revenue for Star Tech", "Times New Roman Bold Italic", 18)
' Add a multi-color bar chart layer using the supplied data. Use glass lighting effect with
' light direction from the left.
c.addBarLayer3(data).setBorderColor(Chart.Transparent, Chart.glassEffect(Chart.NormalGlare, _
Chart.Left))
' Set the x axis labels
c.xAxis().setLabels(labels)
' Show the same scale on the left and right y-axes
c.syncYAxis()
' Set the left y-axis and right y-axis title using 10pt Arial Bold font
c.yAxis().setTitle("USD (millions)", "Arial Bold", 10)
c.yAxis2().setTitle("USD (millions)", "Arial Bold", 10)
' Set all axes to transparent
c.xAxis().setColors(Chart.Transparent)
c.yAxis().setColors(Chart.Transparent)
c.yAxis2().setColors(Chart.Transparent)
' Set the label styles of all axes to 8pt Arial Bold font
c.xAxis().setLabelStyle("Arial Bold", 8)
c.yAxis().setLabelStyle("Arial Bold", 8)
c.yAxis2().setLabelStyle("Arial Bold", 8)
' Output the chart
WebChartViewer1.Image = c.makeWebImage(Chart.SVG)
' Include tool tip for the chart
WebChartViewer1.ImageMap = c.getHTMLImageMap("", "", "title='Year {xLabel}: US$ {value}M'")
End Sub
</script>
<html>
<head>
<script type="text/javascript" src="cdjcv.js"></script>
</head>
<body>
<chart:WebChartViewer id="WebChartViewer1" runat="server" />
</body>
</html>
[ASP.NET MVC - Controller] NetMvcCharts\Controllers\GlasslightbarController.cs
using System;
using System.Web.Mvc;
using ChartDirector;

namespace NetMvcCharts.Controllers
{
    public class GlasslightbarController : Controller
    {
        //
        // Default Action
        //
        public ActionResult Index()
        {
            ViewBag.Title = "Glass Bar Shading";
            createChart(ViewBag.Viewer = new RazorChartViewer(HttpContext, "chart1"));
            return View("~/Views/Shared/ChartView.cshtml");
        }

        //
        // Create chart
        //
        private void createChart(RazorChartViewer viewer)
        {
            // The data for the bar chart
            double[] data = {450, 560, 630, 800, 1100, 1350, 1600, 1950, 2300, 2700};

            // The labels for the bar chart
            string[] labels = {"1996", "1997", "1998", "1999", "2000", "2001", "2002", "2003", "2004",
                "2005"};

            // Create a XYChart object of size 600 x 360 pixels
            XYChart c = new XYChart(600, 360);

            // Set the plotarea at (60, 40) and of size 480 x 280 pixels. Use a vertical gradient color
            // from light blue (eeeeff) to deep blue (0000cc) as background. Set border and grid lines to
            // white (ffffff).
            c.setPlotArea(60, 40, 480, 280, c.linearGradientColor(60, 40, 60, 280, 0xeeeeff, 0x0000cc),
                -1, 0xffffff, 0xffffff);

            // Add a title to the chart using 18pt Times Bold Italic font
            c.addTitle("Annual Revenue for Star Tech", "Times New Roman Bold Italic", 18);

            // Add a multi-color bar chart layer using the supplied data. Use glass lighting effect with
            // light direction from the left.
            c.addBarLayer3(data).setBorderColor(Chart.Transparent, Chart.glassEffect(Chart.NormalGlare,
                Chart.Left));

            // Set the x axis labels
            c.xAxis().setLabels(labels);

            // Show the same scale on the left and right y-axes
            c.syncYAxis();

            // Set the left y-axis and right y-axis title using 10pt Arial Bold font
            c.yAxis().setTitle("USD (millions)", "Arial Bold", 10);
            c.yAxis2().setTitle("USD (millions)", "Arial Bold", 10);

            // Set all axes to transparent
            c.xAxis().setColors(Chart.Transparent);
            c.yAxis().setColors(Chart.Transparent);
            c.yAxis2().setColors(Chart.Transparent);

            // Set the label styles of all axes to 8pt Arial Bold font
            c.xAxis().setLabelStyle("Arial Bold", 8);
            c.yAxis().setLabelStyle("Arial Bold", 8);
            c.yAxis2().setLabelStyle("Arial Bold", 8);

            // Output the chart
            viewer.Image = c.makeWebImage(Chart.SVG);

            // Include tool tip for the chart
            viewer.ImageMap = c.getHTMLImageMap("", "", "title='Year {xLabel}: US$ {value}M'");
        }
    }
}
[ASP.NET MVC - View] NetMvcCharts\Views\Shared\ChartView.cshtml
@{ Layout = null; }

<!DOCTYPE html>

<html>
<head>
    <meta name="viewport" content="width=device-width" />
    <title>@ViewBag.Title</title>
    <style>
        @ViewBag.Style
    </style>
    @Scripts.Render("~/Scripts/cdjcv.js")
</head>
<body style="margin:5px 0px 0px 5px">
    <div style="font:bold 18pt verdana;">
        @ViewBag.Title
    </div>
    <hr style="border:solid 1px #000080; background:#000080" />
    <div>
        @{
            if (ViewBag.Viewer is Array)
            {
                // Display multiple charts
                for (int i = 0; i < ViewBag.Viewer.Length; ++i)
                {
                    @:@Html.Raw(ViewBag.Viewer[i].RenderHTML())
                }
            }
            else
            {
                // Display one chart only
                @:@Html.Raw(ViewBag.Viewer.RenderHTML())
            }
        }
    </div>
</body>
</html>
© 2023 Advanced Software Engineering Limited. All rights reserved.