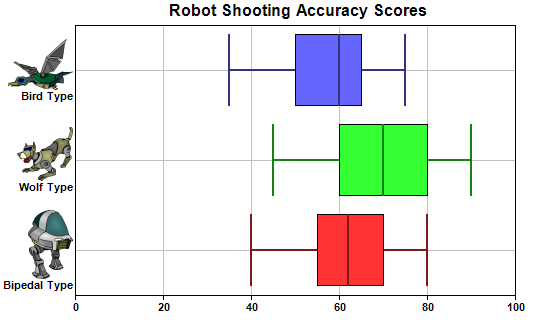
This example demonstrates creating a multi-color horizontal box-whisker chart.
XYChart.addBoxWhiskerLayer2 is used to create the multi-color box-whisker layer. The chart is set to horizontal orientation using XYChart.swapXY.
ChartDirector 7.1 (.NET Edition)
Horizontal Box-Whisker Chart
Source Code Listing
using System;
using ChartDirector;

namespace CSharpChartExplorer
{
    public class hboxwhisker : DemoModule
    {
        //Name of demo module
        public string getName() { return "Horizontal Box-Whisker Chart"; }

        //Number of charts produced in this demo module
        public int getNoOfCharts() { return 1; }

        //Main code for creating chart.
        //Note: the argument chartIndex is unused because this demo only has 1 chart.
        public void createChart(WinChartViewer viewer, int chartIndex)
        {
            // Sample data for the Box-Whisker chart. Represents the minimum, 1st quartile, medium,
            // 3rd quartile and maximum values of some quantities
            double[] Q0Data = {40, 45, 35};
            double[] Q1Data = {55, 60, 50};
            double[] Q2Data = {62, 70, 60};
            double[] Q3Data = {70, 80, 65};
            double[] Q4Data = {80, 90, 75};

            // The labels for the chart
            string[] labels = {"<*img=@/images/robot1.png*><*br*>Bipedal Type",
                "<*img=@/images/robot2.png*><*br*>Wolf Type",
                "<*img=@/images/robot5.png*><*br*>Bird Type"};

            // Create a XYChart object of size 540 x 320 pixels
            XYChart c = new XYChart(540, 320);

            // swap the x and y axes to create a horizontal box-whisker chart
            c.swapXY();

            // Set the plotarea at (75, 25) and of size 440 x 270 pixels. Enable both horizontal and
            // vertical grids by setting their colors to grey (0xc0c0c0)
            c.setPlotArea(75, 25, 440, 270).setGridColor(0xc0c0c0, 0xc0c0c0);

            // Add a title to the chart
            c.addTitle("           Robot Shooting Accuracy Scores");

            // Set the labels on the x axis and the font to Arial Bold
            c.xAxis().setLabels(labels).setFontStyle("Arial Bold");

            // Disable x axis ticks by setting the length to 0
            c.xAxis().setTickLength(0);

            // Set the font for the y axis labels to Arial Bold
            c.yAxis().setLabelStyle("Arial Bold");

            // Add a Box Whisker layer using light blue 0x9999ff as the fill color and blue (0xcc)
            // as the line color. Set the line width to 2 pixels
            c.addBoxWhiskerLayer2(Q3Data, Q1Data, Q4Data, Q0Data, Q2Data).setLineWidth(2);

            // Output the chart
            viewer.Chart = c;

            //include tool tip for the chart
            viewer.ImageMap = c.getHTMLImageMap("clickable", "",
                "title='{xLabel}: min/med/max = {min}/{med}/{max}\nInter-quartile range: " +
                "{bottom} to {top}'");
        }
    }
}Imports System
Imports Microsoft.VisualBasic
Imports ChartDirector
Public Class hboxwhisker
Implements DemoModule
'Name of demo module
Public Function getName() As String Implements DemoModule.getName
Return "Horizontal Box-Whisker Chart"
End Function
'Number of charts produced in this demo module
Public Function getNoOfCharts() As Integer Implements DemoModule.getNoOfCharts
Return 1
End Function
'Main code for creating chart.
'Note: the argument chartIndex is unused because this demo only has 1 chart.
Public Sub createChart(viewer As WinChartViewer, chartIndex As Integer) _
Implements DemoModule.createChart
' Sample data for the Box-Whisker chart. Represents the minimum, 1st quartile, medium, 3rd
' quartile and maximum values of some quantities
Dim Q0Data() As Double = {40, 45, 35}
Dim Q1Data() As Double = {55, 60, 50}
Dim Q2Data() As Double = {62, 70, 60}
Dim Q3Data() As Double = {70, 80, 65}
Dim Q4Data() As Double = {80, 90, 75}
' The labels for the chart
Dim labels() As String = {"<*img=@/robot1.png*><*br*>Bipedal Type", _
"<*img=@/robot2.png*><*br*>Wolf Type", "<*img=@/robot5.png*><*br*>Bird Type"}
' Create a XYChart object of size 540 x 320 pixels
Dim c As XYChart = New XYChart(540, 320)
' swap the x and y axes to create a horizontal box-whisker chart
c.swapXY()
' Set the plotarea at (75, 25) and of size 440 x 270 pixels. Enable both horizontal and
' vertical grids by setting their colors to grey (0xc0c0c0)
c.setPlotArea(75, 25, 440, 270).setGridColor(&Hc0c0c0, &Hc0c0c0)
' Add a title to the chart
c.addTitle(" Robot Shooting Accuracy Scores")
' Set the labels on the x axis and the font to Arial Bold
c.xAxis().setLabels(labels).setFontStyle("Arial Bold")
' Disable x axis ticks by setting the length to 0
c.xAxis().setTickLength(0)
' Set the font for the y axis labels to Arial Bold
c.yAxis().setLabelStyle("Arial Bold")
' Add a Box Whisker layer using light blue 0x9999ff as the fill color and blue (0xcc) as the
' line color. Set the line width to 2 pixels
c.addBoxWhiskerLayer2(Q3Data, Q1Data, Q4Data, Q0Data, Q2Data).setLineWidth(2)
' Output the chart
viewer.Chart = c
'include tool tip for the chart
viewer.ImageMap = c.getHTMLImageMap("clickable", "", _
"title='{xLabel}: min/med/max = {min}/{med}/{max}" & vbLf & _
"Inter-quartile range: {bottom} to {top}'")
End Sub
End Classusing System;
using ChartDirector;
namespace CSharpWPFCharts
{
public class hboxwhisker : DemoModule
{
//Name of demo module
public string getName() { return "Horizontal Box-Whisker Chart"; }
//Number of charts produced in this demo module
public int getNoOfCharts() { return 1; }
//Main code for creating chart.
//Note: the argument chartIndex is unused because this demo only has 1 chart.
public void createChart(WPFChartViewer viewer, int chartIndex)
{
// Sample data for the Box-Whisker chart. Represents the minimum, 1st quartile, medium,
// 3rd quartile and maximum values of some quantities
double[] Q0Data = {40, 45, 35};
double[] Q1Data = {55, 60, 50};
double[] Q2Data = {62, 70, 60};
double[] Q3Data = {70, 80, 65};
double[] Q4Data = {80, 90, 75};
// The labels for the chart
string[] labels = {"<*img=@/images/robot1.png*><*br*>Bipedal Type",
"<*img=@/images/robot2.png*><*br*>Wolf Type",
"<*img=@/images/robot5.png*><*br*>Bird Type"};
// Create a XYChart object of size 540 x 320 pixels
XYChart c = new XYChart(540, 320);
// swap the x and y axes to create a horizontal box-whisker chart
c.swapXY();
// Set the plotarea at (75, 25) and of size 440 x 270 pixels. Enable both horizontal and
// vertical grids by setting their colors to grey (0xc0c0c0)
c.setPlotArea(75, 25, 440, 270).setGridColor(0xc0c0c0, 0xc0c0c0);
// Add a title to the chart
c.addTitle(" Robot Shooting Accuracy Scores");
// Set the labels on the x axis and the font to Arial Bold
c.xAxis().setLabels(labels).setFontStyle("Arial Bold");
// Disable x axis ticks by setting the length to 0
c.xAxis().setTickLength(0);
// Set the font for the y axis labels to Arial Bold
c.yAxis().setLabelStyle("Arial Bold");
// Add a Box Whisker layer using light blue 0x9999ff as the fill color and blue (0xcc)
// as the line color. Set the line width to 2 pixels
c.addBoxWhiskerLayer2(Q3Data, Q1Data, Q4Data, Q0Data, Q2Data).setLineWidth(2);
// Output the chart
viewer.Chart = c;
//include tool tip for the chart
viewer.ImageMap = c.getHTMLImageMap("clickable", "",
"title='{xLabel}: min/med/max = {min}/{med}/{max}\nInter-quartile range: " +
"{bottom} to {top}'");
}
}
}<%@ Page Language="C#" Debug="true" %>
<%@ Import Namespace="ChartDirector" %>
<%@ Register TagPrefix="chart" Namespace="ChartDirector" Assembly="netchartdir" %>
<!DOCTYPE html>
<script runat="server">
//
// Page Load event handler
//
protected void Page_Load(object sender, EventArgs e)
{
// Sample data for the Box-Whisker chart. Represents the minimum, 1st quartile, medium, 3rd
// quartile and maximum values of some quantities
double[] Q0Data = {40, 45, 35};
double[] Q1Data = {55, 60, 50};
double[] Q2Data = {62, 70, 60};
double[] Q3Data = {70, 80, 65};
double[] Q4Data = {80, 90, 75};
// The labels for the chart
string[] labels = {"<*img=robot1.png*><*br*>Bipedal Type", "<*img=robot2.png*><*br*>Wolf Type",
"<*img=robot5.png*><*br*>Bird Type"};
// Create a XYChart object of size 540 x 320 pixels
XYChart c = new XYChart(540, 320);
// swap the x and y axes to create a horizontal box-whisker chart
c.swapXY();
//Set default directory for loading images from current script directory
c.setSearchPath(Server.MapPath("."));
// Set the plotarea at (75, 25) and of size 440 x 270 pixels. Enable both horizontal and
// vertical grids by setting their colors to grey (0xc0c0c0)
c.setPlotArea(75, 25, 440, 270).setGridColor(0xc0c0c0, 0xc0c0c0);
// Add a title to the chart
c.addTitle(" Robot Shooting Accuracy Scores");
// Set the labels on the x axis and the font to Arial Bold
c.xAxis().setLabels(labels).setFontStyle("Arial Bold");
// Disable x axis ticks by setting the length to 0
c.xAxis().setTickLength(0);
// Set the font for the y axis labels to Arial Bold
c.yAxis().setLabelStyle("Arial Bold");
// Add a Box Whisker layer using light blue 0x9999ff as the fill color and blue (0xcc) as the
// line color. Set the line width to 2 pixels
c.addBoxWhiskerLayer2(Q3Data, Q1Data, Q4Data, Q0Data, Q2Data).setLineWidth(2);
// Output the chart
WebChartViewer1.Image = c.makeWebImage(Chart.SVG);
// Include tool tip for the chart
WebChartViewer1.ImageMap = c.getHTMLImageMap("", "",
"title='{xLabel}: min/med/max = {min}/{med}/{max}\nInter-quartile range: {bottom} to {top}'"
);
}
</script>
<html>
<head>
<script type="text/javascript" src="cdjcv.js"></script>
</head>
<body>
<chart:WebChartViewer id="WebChartViewer1" runat="server" />
</body>
</html><%@ Page Language="VB" Debug="true" %>
<%@ Import Namespace="ChartDirector" %>
<%@ Register TagPrefix="chart" Namespace="ChartDirector" Assembly="netchartdir" %>
<!DOCTYPE html>
<script runat="server">
'
' Page Load event handler
'
Protected Sub Page_Load(ByVal sender As System.Object, ByVal e As System.EventArgs)
' Sample data for the Box-Whisker chart. Represents the minimum, 1st quartile, medium, 3rd
' quartile and maximum values of some quantities
Dim Q0Data() As Double = {40, 45, 35}
Dim Q1Data() As Double = {55, 60, 50}
Dim Q2Data() As Double = {62, 70, 60}
Dim Q3Data() As Double = {70, 80, 65}
Dim Q4Data() As Double = {80, 90, 75}
' The labels for the chart
Dim labels() As String = {"<*img=robot1.png*><*br*>Bipedal Type", _
"<*img=robot2.png*><*br*>Wolf Type", "<*img=robot5.png*><*br*>Bird Type"}
' Create a XYChart object of size 540 x 320 pixels
Dim c As XYChart = New XYChart(540, 320)
' swap the x and y axes to create a horizontal box-whisker chart
c.swapXY()
' Set default directory for loading images from current script directory
Call c.setSearchPath(Server.MapPath("."))
' Set the plotarea at (75, 25) and of size 440 x 270 pixels. Enable both horizontal and vertical
' grids by setting their colors to grey (0xc0c0c0)
c.setPlotArea(75, 25, 440, 270).setGridColor(&Hc0c0c0, &Hc0c0c0)
' Add a title to the chart
c.addTitle(" Robot Shooting Accuracy Scores")
' Set the labels on the x axis and the font to Arial Bold
c.xAxis().setLabels(labels).setFontStyle("Arial Bold")
' Disable x axis ticks by setting the length to 0
c.xAxis().setTickLength(0)
' Set the font for the y axis labels to Arial Bold
c.yAxis().setLabelStyle("Arial Bold")
' Add a Box Whisker layer using light blue 0x9999ff as the fill color and blue (0xcc) as the
' line color. Set the line width to 2 pixels
c.addBoxWhiskerLayer2(Q3Data, Q1Data, Q4Data, Q0Data, Q2Data).setLineWidth(2)
' Output the chart
WebChartViewer1.Image = c.makeWebImage(Chart.SVG)
' Include tool tip for the chart
WebChartViewer1.ImageMap = c.getHTMLImageMap("", "", _
"title='{xLabel}: min/med/max = {min}/{med}/{max}" & vbLf & _
"Inter-quartile range: {bottom} to {top}'")
End Sub
</script>
<html>
<head>
<script type="text/javascript" src="cdjcv.js"></script>
</head>
<body>
<chart:WebChartViewer id="WebChartViewer1" runat="server" />
</body>
</html>using System;
using System.Web.Mvc;
using ChartDirector;
namespace NetMvcCharts.Controllers
{
public class HboxwhiskerController : Controller
{
//
// Default Action
//
public ActionResult Index()
{
ViewBag.Title = "Horizontal Box-Whisker Chart";
createChart(ViewBag.Viewer = new RazorChartViewer(HttpContext, "chart1"));
return View("~/Views/Shared/ChartView.cshtml");
}
//
// Create chart
//
private void createChart(RazorChartViewer viewer)
{
// Sample data for the Box-Whisker chart. Represents the minimum, 1st quartile, medium, 3rd
// quartile and maximum values of some quantities
double[] Q0Data = {40, 45, 35};
double[] Q1Data = {55, 60, 50};
double[] Q2Data = {62, 70, 60};
double[] Q3Data = {70, 80, 65};
double[] Q4Data = {80, 90, 75};
// The labels for the chart
string[] labels = {"<*img=robot1.png*><*br*>Bipedal Type",
"<*img=robot2.png*><*br*>Wolf Type", "<*img=robot5.png*><*br*>Bird Type"};
// Create a XYChart object of size 540 x 320 pixels
XYChart c = new XYChart(540, 320);
// swap the x and y axes to create a horizontal box-whisker chart
c.swapXY();
//Set default directory for loading images
c.setSearchPath(Url.Content("~/Content"));
// Set the plotarea at (75, 25) and of size 440 x 270 pixels. Enable both horizontal and
// vertical grids by setting their colors to grey (0xc0c0c0)
c.setPlotArea(75, 25, 440, 270).setGridColor(0xc0c0c0, 0xc0c0c0);
// Add a title to the chart
c.addTitle(" Robot Shooting Accuracy Scores");
// Set the labels on the x axis and the font to Arial Bold
c.xAxis().setLabels(labels).setFontStyle("Arial Bold");
// Disable x axis ticks by setting the length to 0
c.xAxis().setTickLength(0);
// Set the font for the y axis labels to Arial Bold
c.yAxis().setLabelStyle("Arial Bold");
// Add a Box Whisker layer using light blue 0x9999ff as the fill color and blue (0xcc) as the
// line color. Set the line width to 2 pixels
c.addBoxWhiskerLayer2(Q3Data, Q1Data, Q4Data, Q0Data, Q2Data).setLineWidth(2);
// Output the chart
viewer.Image = c.makeWebImage(Chart.SVG);
// Include tool tip for the chart
viewer.ImageMap = c.getHTMLImageMap("", "",
"title='{xLabel}: min/med/max = {min}/{med}/{max}\nInter-quartile range: {bottom} to " +
"{top}'");
}
}
}@{ Layout = null; }
<!DOCTYPE html>
<html>
<head>
<meta name="viewport" content="width=device-width" />
<title>@ViewBag.Title</title>
<style>
@ViewBag.Style
</style>
@Scripts.Render("~/Scripts/cdjcv.js")
</head>
<body style="margin:5px 0px 0px 5px">
<div style="font:bold 18pt verdana;">
@ViewBag.Title
</div>
<hr style="border:solid 1px #000080; background:#000080" />
<div>
@{
if (ViewBag.Viewer is Array)
{
// Display multiple charts
for (int i = 0; i < ViewBag.Viewer.Length; ++i)
{
@:@Html.Raw(ViewBag.Viewer[i].RenderHTML())
}
}
else
{
// Display one chart only
@:@Html.Raw(ViewBag.Viewer.RenderHTML())
}
}
</div>
</body>
</html>