[Windows Forms - C# version] NetWinCharts\CSharpWinCharts\markbar.cs
using System;
using ChartDirector;
namespace CSharpChartExplorer
{
public class markbar : DemoModule
{
//Name of demo module
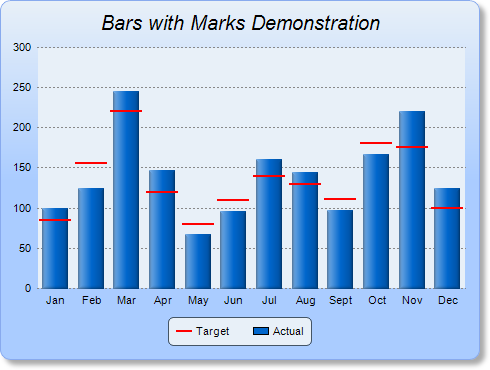
public string getName() { return "Bars with Marks"; }
//Number of charts produced in this demo module
public int getNoOfCharts() { return 1; }
//Main code for creating chart.
//Note: the argument chartIndex is unused because this demo only has 1 chart.
public void createChart(WinChartViewer viewer, int chartIndex)
{
// The data for the bars and the marks
double[] barData = {100, 125, 245, 147, 67, 96, 160, 145, 97, 167, 220, 125};
double[] markData = {85, 156, 220, 120, 80, 110, 140, 130, 111, 180, 175, 100};
// The labels for the bar chart
string[] labels = {"Jan", "Feb", "Mar", "Apr", "May", "Jun", "Jul", "Aug", "Sept",
"Oct", "Nov", "Dec"};
// Create a XYChart object of size 480 x 360 pixels. Use a vertical gradient color from
// pale blue (e8f0f8) to sky blue (aaccff) spanning half the chart height as background.
// Set border to blue (88aaee). Use rounded corners. Enable soft drop shadow.
XYChart c = new XYChart(480, 360);
c.setBackground(c.linearGradientColor(0, 0, 0, c.getHeight() / 2, 0xe8f0f8, 0xaaccff),
0x88aaee);
c.setRoundedFrame();
c.setDropShadow();
// Add a title to the chart using 15 points Arial Italic font. Set top/bottom margins to
// 12 pixels.
ChartDirector.TextBox title = c.addTitle("Bars with Marks Demonstration",
"Arial Italic", 15);
title.setMargin2(0, 0, 12, 12);
// Tentatively set the plotarea to 50 pixels from the left edge to allow for the y-axis,
// and to just under the title. Set the width to 65 pixels less than the chart width,
// and the height to reserve 90 pixels at the bottom for the x-axis and the legend box.
// Use pale blue (e8f0f8) background, transparent border, and grey (888888) dotted
// horizontal grid lines.
c.setPlotArea(50, title.getHeight(), c.getWidth() - 65, c.getHeight() - title.getHeight(
) - 90, 0xe8f0f8, -1, Chart.Transparent, c.dashLineColor(0x888888, Chart.DotLine));
// Add a legend box where the bottom-center is anchored to the 15 pixels above the
// bottom-center of the chart. Use horizontal layout and 8 points Arial font.
LegendBox legendBox = c.addLegend(c.getWidth() / 2, c.getHeight() - 15, false, "Arial",
8);
legendBox.setAlignment(Chart.BottomCenter);
// Set the legend box background and border to pale blue (e8f0f8) and bluish grey
// (445566)
legendBox.setBackground(0xe8f0f8, 0x445566);
// Use rounded corners of 5 pixel radius for the legend box
legendBox.setRoundedCorners(5);
// Use line style legend key
legendBox.setLineStyleKey();
// Set axes to transparent
c.xAxis().setColors(Chart.Transparent);
c.yAxis().setColors(Chart.Transparent);
// Set the labels on the x axis
c.xAxis().setLabels(labels);
// Add a box-whisker layer with just the middle mark visible for the marks. Use red
// (ff0000) color for the mark, with a line width of 2 pixels and 10% horizontal gap
BoxWhiskerLayer markLayer = c.addBoxWhiskerLayer(null, null, null, null, markData, -1,
0xff0000);
markLayer.setLineWidth(2);
markLayer.setDataGap(0.1);
// Add the legend key for the mark line
legendBox.addKey("Target", 0xff0000, 2);
// Tool tip for the mark layer
markLayer.setHTMLImageMap("", "", "title='Target at {xLabel}: {med}'");
// Add a blue (0066cc) bar layer using the given data.
BarLayer barLayer = c.addBarLayer(barData, 0x0066cc, "Actual");
// Use soft lighting effect for the bars with light direction from left.
barLayer.setBorderColor(Chart.Transparent, Chart.softLighting(Chart.Left));
// Tool tip for the bar layer
barLayer.setHTMLImageMap("", "", "title='{dataSetName} at {xLabel}: {value}'");
// Adjust the plot area size, such that the bounding box (inclusive of axes) is 10
// pixels from the left edge, just below the title, 15 pixels from the right edge, and
// 10 pixels above the legend box.
c.packPlotArea(10, title.getHeight(), c.getWidth() - 15, c.layoutLegend().getTopY() - 10
);
// Output the chart
viewer.Chart = c;
// Include tool tip for the chart
viewer.ImageMap = c.getHTMLImageMap("clickable");
}
}
}
[Windows Forms - VB Version] NetWinCharts\VBNetWinCharts\markbar.vb
Imports System
Imports Microsoft.VisualBasic
Imports ChartDirector

Public Class markbar
    Implements DemoModule

    'Name of demo module
    Public Function getName() As String Implements DemoModule.getName
        Return "Bars with Marks"
    End Function

    'Number of charts produced in this demo module
    Public Function getNoOfCharts() As Integer Implements DemoModule.getNoOfCharts
        Return 1
    End Function

    'Main code for creating chart.
    'Note: the argument chartIndex is unused because this demo only has 1 chart.
    Public Sub createChart(viewer As WinChartViewer, chartIndex As Integer) _
        Implements DemoModule.createChart

        ' The data for the bars and the marks
        Dim barData() As Double = {100, 125, 245, 147, 67, 96, 160, 145, 97, 167, 220, 125}
        Dim markData() As Double = {85, 156, 220, 120, 80, 110, 140, 130, 111, 180, 175, 100}

        ' The labels for the bar chart
        Dim labels() As String = {"Jan", "Feb", "Mar", "Apr", "May", "Jun", "Jul", "Aug", "Sept", _
            "Oct", "Nov", "Dec"}

        ' Create a XYChart object of size 480 x 360 pixels. Use a vertical gradient color from pale
        ' blue (e8f0f8) to sky blue (aaccff) spanning half the chart height as background. Set
        ' border to blue (88aaee). Use rounded corners. Enable soft drop shadow.
        Dim c As XYChart = New XYChart(480, 360)
        c.setBackground(c.linearGradientColor(0, 0, 0, c.getHeight() / 2, &He8f0f8, &Haaccff), _
            &H88aaee)
        c.setRoundedFrame()
        c.setDropShadow()

        ' Add a title to the chart using 15 points Arial Italic font. Set top/bottom margins to 12
        ' pixels.
        Dim title As ChartDirector.TextBox = c.addTitle("Bars with Marks Demonstration", _
            "Arial Italic", 15)
        title.setMargin2(0, 0, 12, 12)

        ' Tentatively set the plotarea to 50 pixels from the left edge to allow for the y-axis, and
        ' to just under the title. Set the width to 65 pixels less than the chart width, and the
        ' height to reserve 90 pixels at the bottom for the x-axis and the legend box. Use pale blue
        ' (e8f0f8) background, transparent border, and grey (888888) dotted horizontal grid lines.
        c.setPlotArea(50, title.getHeight(), c.getWidth() - 65, c.getHeight() - title.getHeight() _
             - 90, &He8f0f8, -1, Chart.Transparent, c.dashLineColor(&H888888, Chart.DotLine))

        ' Add a legend box where the bottom-center is anchored to the 15 pixels above the
        ' bottom-center of the chart. Use horizontal layout and 8 points Arial font.
        Dim legendBox As LegendBox = c.addLegend(c.getWidth() / 2, c.getHeight() - 15, False, _
            "Arial", 8)
        legendBox.setAlignment(Chart.BottomCenter)

        ' Set the legend box background and border to pale blue (e8f0f8) and bluish grey (445566)
        legendBox.setBackground(&He8f0f8, &H445566)

        ' Use rounded corners of 5 pixel radius for the legend box
        legendBox.setRoundedCorners(5)

        ' Use line style legend key
        legendBox.setLineStyleKey()

        ' Set axes to transparent
        c.xAxis().setColors(Chart.Transparent)
        c.yAxis().setColors(Chart.Transparent)

        ' Set the labels on the x axis
        c.xAxis().setLabels(labels)

        ' Add a box-whisker layer with just the middle mark visible for the marks. Use red (ff0000)
        ' color for the mark, with a line width of 2 pixels and 10% horizontal gap
        Dim markLayer As BoxWhiskerLayer = c.addBoxWhiskerLayer(Nothing, Nothing, Nothing, _
            Nothing, markData, -1, &Hff0000)
        markLayer.setLineWidth(2)
        markLayer.setDataGap(0.1)

        ' Add the legend key for the mark line
        legendBox.addKey("Target", &Hff0000, 2)

        ' Tool tip for the mark layer
        markLayer.setHTMLImageMap("", "", "title='Target at {xLabel}: {med}'")

        ' Add a blue (0066cc) bar layer using the given data.
        Dim barLayer As BarLayer = c.addBarLayer(barData, &H0066cc, "Actual")

        ' Use soft lighting effect for the bars with light direction from left.
        barLayer.setBorderColor(Chart.Transparent, Chart.softLighting(Chart.Left))

        ' Tool tip for the bar layer
        barLayer.setHTMLImageMap("", "", "title='{dataSetName} at {xLabel}: {value}'")

        ' Adjust the plot area size, such that the bounding box (inclusive of axes) is 10 pixels
        ' from the left edge, just below the title, 15 pixels from the right edge, and 10 pixels
        ' above the legend box.
        c.packPlotArea(10, title.getHeight(), c.getWidth() - 15, c.layoutLegend().getTopY() - 10)

        ' Output the chart
        viewer.Chart = c

        ' Include tool tip for the chart
        viewer.ImageMap = c.getHTMLImageMap("clickable")

    End Sub

End Class
[WPF - C#] NetWPFCharts\CSharpWPFCharts\markbar.cs
using System;
using ChartDirector;

namespace CSharpWPFCharts
{
    public class markbar : DemoModule
    {
        //Name of demo module
        public string getName() { return "Bars with Marks"; }

        //Number of charts produced in this demo module
        public int getNoOfCharts() { return 1; }

        //Main code for creating chart.
        //Note: the argument chartIndex is unused because this demo only has 1 chart.
        public void createChart(WPFChartViewer viewer, int chartIndex)
        {
            // The data for the bars and the marks
            double[] barData = {100, 125, 245, 147, 67, 96, 160, 145, 97, 167, 220, 125};
            double[] markData = {85, 156, 220, 120, 80, 110, 140, 130, 111, 180, 175, 100};

            // The labels for the bar chart
            string[] labels = {"Jan", "Feb", "Mar", "Apr", "May", "Jun", "Jul", "Aug", "Sept",
                "Oct", "Nov", "Dec"};

            // Create a XYChart object of size 480 x 360 pixels. Use a vertical gradient color from
            // pale blue (e8f0f8) to sky blue (aaccff) spanning half the chart height as background.
            // Set border to blue (88aaee). Use rounded corners. Enable soft drop shadow.
            XYChart c = new XYChart(480, 360);
            c.setBackground(c.linearGradientColor(0, 0, 0, c.getHeight() / 2, 0xe8f0f8, 0xaaccff),
                0x88aaee);
            c.setRoundedFrame();
            c.setDropShadow();

            // Add a title to the chart using 15 points Arial Italic font. Set top/bottom margins to
            // 12 pixels.
            ChartDirector.TextBox title = c.addTitle("Bars with Marks Demonstration",
                "Arial Italic", 15);
            title.setMargin2(0, 0, 12, 12);

            // Tentatively set the plotarea to 50 pixels from the left edge to allow for the y-axis,
            // and to just under the title. Set the width to 65 pixels less than the chart width,
            // and the height to reserve 90 pixels at the bottom for the x-axis and the legend box.
            // Use pale blue (e8f0f8) background, transparent border, and grey (888888) dotted
            // horizontal grid lines.
            c.setPlotArea(50, title.getHeight(), c.getWidth() - 65, c.getHeight() - title.getHeight(
                ) - 90, 0xe8f0f8, -1, Chart.Transparent, c.dashLineColor(0x888888, Chart.DotLine));

            // Add a legend box where the bottom-center is anchored to the 15 pixels above the
            // bottom-center of the chart. Use horizontal layout and 8 points Arial font.
            LegendBox legendBox = c.addLegend(c.getWidth() / 2, c.getHeight() - 15, false, "Arial",
                8);
            legendBox.setAlignment(Chart.BottomCenter);

            // Set the legend box background and border to pale blue (e8f0f8) and bluish grey
            // (445566)
            legendBox.setBackground(0xe8f0f8, 0x445566);

            // Use rounded corners of 5 pixel radius for the legend box
            legendBox.setRoundedCorners(5);

            // Use line style legend key
            legendBox.setLineStyleKey();

            // Set axes to transparent
            c.xAxis().setColors(Chart.Transparent);
            c.yAxis().setColors(Chart.Transparent);

            // Set the labels on the x axis
            c.xAxis().setLabels(labels);

            // Add a box-whisker layer with just the middle mark visible for the marks. Use red
            // (ff0000) color for the mark, with a line width of 2 pixels and 10% horizontal gap
            BoxWhiskerLayer markLayer = c.addBoxWhiskerLayer(null, null, null, null, markData, -1,
                0xff0000);
            markLayer.setLineWidth(2);
            markLayer.setDataGap(0.1);

            // Add the legend key for the mark line
            legendBox.addKey("Target", 0xff0000, 2);

            // Tool tip for the mark layer
            markLayer.setHTMLImageMap("", "", "title='Target at {xLabel}: {med}'");

            // Add a blue (0066cc) bar layer using the given data.
            BarLayer barLayer = c.addBarLayer(barData, 0x0066cc, "Actual");

            // Use soft lighting effect for the bars with light direction from left.
            barLayer.setBorderColor(Chart.Transparent, Chart.softLighting(Chart.Left));

            // Tool tip for the bar layer
            barLayer.setHTMLImageMap("", "", "title='{dataSetName} at {xLabel}: {value}'");

            // Adjust the plot area size, such that the bounding box (inclusive of axes) is 10
            // pixels from the left edge, just below the title, 15 pixels from the right edge, and
            // 10 pixels above the legend box.
            c.packPlotArea(10, title.getHeight(), c.getWidth() - 15, c.layoutLegend().getTopY() - 10
                );

            // Output the chart
            viewer.Chart = c;

            // Include tool tip for the chart
            viewer.ImageMap = c.getHTMLImageMap("clickable");
        }
    }
}
[ASP.NET Web Forms - C# version] NetWebCharts\CSharpASP\markbar.aspx
(Click here on how to convert this code to code-behind style.)<%@ Page Language="C#" Debug="true" %>
<%@ Import Namespace="ChartDirector" %>
<%@ Register TagPrefix="chart" Namespace="ChartDirector" Assembly="netchartdir" %>
<!DOCTYPE html>
<script runat="server">
//
// Page Load event handler
//
protected void Page_Load(object sender, EventArgs e)
{
// The data for the bars and the marks
double[] barData = {100, 125, 245, 147, 67, 96, 160, 145, 97, 167, 220, 125};
double[] markData = {85, 156, 220, 120, 80, 110, 140, 130, 111, 180, 175, 100};
// The labels for the bar chart
string[] labels = {"Jan", "Feb", "Mar", "Apr", "May", "Jun", "Jul", "Aug", "Sept", "Oct", "Nov",
"Dec"};
// Create a XYChart object of size 480 x 360 pixels. Use a vertical gradient color from pale
// blue (e8f0f8) to sky blue (aaccff) spanning half the chart height as background. Set border
// to blue (88aaee). Use rounded corners. Enable soft drop shadow.
XYChart c = new XYChart(480, 360);
c.setBackground(c.linearGradientColor(0, 0, 0, c.getHeight() / 2, 0xe8f0f8, 0xaaccff), 0x88aaee)
;
c.setRoundedFrame();
c.setDropShadow();
// Add a title to the chart using 15 points Arial Italic font. Set top/bottom margins to 12
// pixels.
ChartDirector.TextBox title = c.addTitle("Bars with Marks Demonstration", "Arial Italic", 15);
title.setMargin2(0, 0, 12, 12);
// Tentatively set the plotarea to 50 pixels from the left edge to allow for the y-axis, and to
// just under the title. Set the width to 65 pixels less than the chart width, and the height to
// reserve 90 pixels at the bottom for the x-axis and the legend box. Use pale blue (e8f0f8)
// background, transparent border, and grey (888888) dotted horizontal grid lines.
c.setPlotArea(50, title.getHeight(), c.getWidth() - 65, c.getHeight() - title.getHeight() - 90,
0xe8f0f8, -1, Chart.Transparent, c.dashLineColor(0x888888, Chart.DotLine));
// Add a legend box where the bottom-center is anchored to the 15 pixels above the bottom-center
// of the chart. Use horizontal layout and 8 points Arial font.
LegendBox legendBox = c.addLegend(c.getWidth() / 2, c.getHeight() - 15, false, "Arial", 8);
legendBox.setAlignment(Chart.BottomCenter);
// Set the legend box background and border to pale blue (e8f0f8) and bluish grey (445566)
legendBox.setBackground(0xe8f0f8, 0x445566);
// Use rounded corners of 5 pixel radius for the legend box
legendBox.setRoundedCorners(5);
// Use line style legend key
legendBox.setLineStyleKey();
// Set axes to transparent
c.xAxis().setColors(Chart.Transparent);
c.yAxis().setColors(Chart.Transparent);
// Set the labels on the x axis
c.xAxis().setLabels(labels);
// Add a box-whisker layer with just the middle mark visible for the marks. Use red (ff0000)
// color for the mark, with a line width of 2 pixels and 10% horizontal gap
BoxWhiskerLayer markLayer = c.addBoxWhiskerLayer(null, null, null, null, markData, -1, 0xff0000)
;
markLayer.setLineWidth(2);
markLayer.setDataGap(0.1);
// Add the legend key for the mark line
legendBox.addKey("Target", 0xff0000, 2);
// Tool tip for the mark layer
markLayer.setHTMLImageMap("", "", "title='Target at {xLabel}: {med}'");
// Add a blue (0066cc) bar layer using the given data.
BarLayer barLayer = c.addBarLayer(barData, 0x0066cc, "Actual");
// Use soft lighting effect for the bars with light direction from left.
barLayer.setBorderColor(Chart.Transparent, Chart.softLighting(Chart.Left));
// Tool tip for the bar layer
barLayer.setHTMLImageMap("", "", "title='{dataSetName} at {xLabel}: {value}'");
// Adjust the plot area size, such that the bounding box (inclusive of axes) is 10 pixels from
// the left edge, just below the title, 15 pixels from the right edge, and 10 pixels above the
// legend box.
c.packPlotArea(10, title.getHeight(), c.getWidth() - 15, c.layoutLegend().getTopY() - 10);
// Output the chart
WebChartViewer1.Image = c.makeWebImage(Chart.SVG);
// Include tool tip for the chart
WebChartViewer1.ImageMap = c.getHTMLImageMap("");
}
</script>
<html>
<head>
<script type="text/javascript" src="cdjcv.js"></script>
</head>
<body>
<chart:WebChartViewer id="WebChartViewer1" runat="server" />
</body>
</html>
[ASP.NET Web Forms - VB Version] NetWebCharts\VBNetASP\markbar.aspx
(Click here on how to convert this code to code-behind style.)<%@ Page Language="VB" Debug="true" %>
<%@ Import Namespace="ChartDirector" %>
<%@ Register TagPrefix="chart" Namespace="ChartDirector" Assembly="netchartdir" %>
<!DOCTYPE html>
<script runat="server">
'
' Page Load event handler
'
Protected Sub Page_Load(ByVal sender As System.Object, ByVal e As System.EventArgs)
' The data for the bars and the marks
Dim barData() As Double = {100, 125, 245, 147, 67, 96, 160, 145, 97, 167, 220, 125}
Dim markData() As Double = {85, 156, 220, 120, 80, 110, 140, 130, 111, 180, 175, 100}
' The labels for the bar chart
Dim labels() As String = {"Jan", "Feb", "Mar", "Apr", "May", "Jun", "Jul", "Aug", "Sept", _
"Oct", "Nov", "Dec"}
' Create a XYChart object of size 480 x 360 pixels. Use a vertical gradient color from pale blue
' (e8f0f8) to sky blue (aaccff) spanning half the chart height as background. Set border to blue
' (88aaee). Use rounded corners. Enable soft drop shadow.
Dim c As XYChart = New XYChart(480, 360)
c.setBackground(c.linearGradientColor(0, 0, 0, c.getHeight() / 2, &He8f0f8, &Haaccff), _
&H88aaee)
c.setRoundedFrame()
c.setDropShadow()
' Add a title to the chart using 15 points Arial Italic font. Set top/bottom margins to 12
' pixels.
Dim title As ChartDirector.TextBox = c.addTitle("Bars with Marks Demonstration", _
"Arial Italic", 15)
title.setMargin2(0, 0, 12, 12)
' Tentatively set the plotarea to 50 pixels from the left edge to allow for the y-axis, and to
' just under the title. Set the width to 65 pixels less than the chart width, and the height to
' reserve 90 pixels at the bottom for the x-axis and the legend box. Use pale blue (e8f0f8)
' background, transparent border, and grey (888888) dotted horizontal grid lines.
c.setPlotArea(50, title.getHeight(), c.getWidth() - 65, c.getHeight() - title.getHeight() - _
90, &He8f0f8, -1, Chart.Transparent, c.dashLineColor(&H888888, Chart.DotLine))
' Add a legend box where the bottom-center is anchored to the 15 pixels above the bottom-center
' of the chart. Use horizontal layout and 8 points Arial font.
Dim legendBox As LegendBox = c.addLegend(c.getWidth() / 2, c.getHeight() - 15, False, "Arial",8)
legendBox.setAlignment(Chart.BottomCenter)
' Set the legend box background and border to pale blue (e8f0f8) and bluish grey (445566)
legendBox.setBackground(&He8f0f8, &H445566)
' Use rounded corners of 5 pixel radius for the legend box
legendBox.setRoundedCorners(5)
' Use line style legend key
legendBox.setLineStyleKey()
' Set axes to transparent
c.xAxis().setColors(Chart.Transparent)
c.yAxis().setColors(Chart.Transparent)
' Set the labels on the x axis
c.xAxis().setLabels(labels)
' Add a box-whisker layer with just the middle mark visible for the marks. Use red (ff0000)
' color for the mark, with a line width of 2 pixels and 10% horizontal gap
Dim markLayer As BoxWhiskerLayer = c.addBoxWhiskerLayer(Nothing, Nothing, Nothing, Nothing, _
markData, -1, &Hff0000)
markLayer.setLineWidth(2)
markLayer.setDataGap(0.1)
' Add the legend key for the mark line
legendBox.addKey("Target", &Hff0000, 2)
' Tool tip for the mark layer
markLayer.setHTMLImageMap("", "", "title='Target at {xLabel}: {med}'")
' Add a blue (0066cc) bar layer using the given data.
Dim barLayer As BarLayer = c.addBarLayer(barData, &H0066cc, "Actual")
' Use soft lighting effect for the bars with light direction from left.
barLayer.setBorderColor(Chart.Transparent, Chart.softLighting(Chart.Left))
' Tool tip for the bar layer
barLayer.setHTMLImageMap("", "", "title='{dataSetName} at {xLabel}: {value}'")
' Adjust the plot area size, such that the bounding box (inclusive of axes) is 10 pixels from
' the left edge, just below the title, 15 pixels from the right edge, and 10 pixels above the
' legend box.
c.packPlotArea(10, title.getHeight(), c.getWidth() - 15, c.layoutLegend().getTopY() - 10)
' Output the chart
WebChartViewer1.Image = c.makeWebImage(Chart.SVG)
' Include tool tip for the chart
WebChartViewer1.ImageMap = c.getHTMLImageMap("")
End Sub
</script>
<html>
<head>
<script type="text/javascript" src="cdjcv.js"></script>
</head>
<body>
<chart:WebChartViewer id="WebChartViewer1" runat="server" />
</body>
</html>
[ASP.NET MVC - Controller] NetMvcCharts\Controllers\MarkbarController.cs
using System;
using System.Web.Mvc;
using ChartDirector;

namespace NetMvcCharts.Controllers
{
    public class MarkbarController : Controller
    {
        //
        // Default Action
        //
        public ActionResult Index()
        {
            ViewBag.Title = "Bars with Marks";
            createChart(ViewBag.Viewer = new RazorChartViewer(HttpContext, "chart1"));
            return View("~/Views/Shared/ChartView.cshtml");
        }

        //
        // Create chart
        //
        private void createChart(RazorChartViewer viewer)
        {
            // The data for the bars and the marks
            double[] barData = {100, 125, 245, 147, 67, 96, 160, 145, 97, 167, 220, 125};
            double[] markData = {85, 156, 220, 120, 80, 110, 140, 130, 111, 180, 175, 100};

            // The labels for the bar chart
            string[] labels = {"Jan", "Feb", "Mar", "Apr", "May", "Jun", "Jul", "Aug", "Sept", "Oct",
                "Nov", "Dec"};

            // Create a XYChart object of size 480 x 360 pixels. Use a vertical gradient color from pale
            // blue (e8f0f8) to sky blue (aaccff) spanning half the chart height as background. Set
            // border to blue (88aaee). Use rounded corners. Enable soft drop shadow.
            XYChart c = new XYChart(480, 360);
            c.setBackground(c.linearGradientColor(0, 0, 0, c.getHeight() / 2, 0xe8f0f8, 0xaaccff),
                0x88aaee);
            c.setRoundedFrame();
            c.setDropShadow();

            // Add a title to the chart using 15 points Arial Italic font. Set top/bottom margins to 12
            // pixels.
            ChartDirector.TextBox title = c.addTitle("Bars with Marks Demonstration", "Arial Italic", 15)
                ;
            title.setMargin2(0, 0, 12, 12);

            // Tentatively set the plotarea to 50 pixels from the left edge to allow for the y-axis, and
            // to just under the title. Set the width to 65 pixels less than the chart width, and the
            // height to reserve 90 pixels at the bottom for the x-axis and the legend box. Use pale blue
            // (e8f0f8) background, transparent border, and grey (888888) dotted horizontal grid lines.
            c.setPlotArea(50, title.getHeight(), c.getWidth() - 65, c.getHeight() - title.getHeight() -
                90, 0xe8f0f8, -1, Chart.Transparent, c.dashLineColor(0x888888, Chart.DotLine));

            // Add a legend box where the bottom-center is anchored to the 15 pixels above the
            // bottom-center of the chart. Use horizontal layout and 8 points Arial font.
            LegendBox legendBox = c.addLegend(c.getWidth() / 2, c.getHeight() - 15, false, "Arial", 8);
            legendBox.setAlignment(Chart.BottomCenter);

            // Set the legend box background and border to pale blue (e8f0f8) and bluish grey (445566)
            legendBox.setBackground(0xe8f0f8, 0x445566);

            // Use rounded corners of 5 pixel radius for the legend box
            legendBox.setRoundedCorners(5);

            // Use line style legend key
            legendBox.setLineStyleKey();

            // Set axes to transparent
            c.xAxis().setColors(Chart.Transparent);
            c.yAxis().setColors(Chart.Transparent);

            // Set the labels on the x axis
            c.xAxis().setLabels(labels);

            // Add a box-whisker layer with just the middle mark visible for the marks. Use red (ff0000)
            // color for the mark, with a line width of 2 pixels and 10% horizontal gap
            BoxWhiskerLayer markLayer = c.addBoxWhiskerLayer(null, null, null, null, markData, -1,
                0xff0000);
            markLayer.setLineWidth(2);
            markLayer.setDataGap(0.1);

            // Add the legend key for the mark line
            legendBox.addKey("Target", 0xff0000, 2);

            // Tool tip for the mark layer
            markLayer.setHTMLImageMap("", "", "title='Target at {xLabel}: {med}'");

            // Add a blue (0066cc) bar layer using the given data.
            BarLayer barLayer = c.addBarLayer(barData, 0x0066cc, "Actual");

            // Use soft lighting effect for the bars with light direction from left.
            barLayer.setBorderColor(Chart.Transparent, Chart.softLighting(Chart.Left));

            // Tool tip for the bar layer
            barLayer.setHTMLImageMap("", "", "title='{dataSetName} at {xLabel}: {value}'");

            // Adjust the plot area size, such that the bounding box (inclusive of axes) is 10 pixels
            // from the left edge, just below the title, 15 pixels from the right edge, and 10 pixels
            // above the legend box.
            c.packPlotArea(10, title.getHeight(), c.getWidth() - 15, c.layoutLegend().getTopY() - 10);

            // Output the chart
            viewer.Image = c.makeWebImage(Chart.SVG);

            // Include tool tip for the chart
            viewer.ImageMap = c.getHTMLImageMap("");
        }
    }
}
[ASP.NET MVC - View] NetMvcCharts\Views\Shared\ChartView.cshtml
@{ Layout = null; }

<!DOCTYPE html>

<html>
<head>
    <meta name="viewport" content="width=device-width" />
    <title>@ViewBag.Title</title>
    <style>
        @ViewBag.Style
    </style>
    @Scripts.Render("~/Scripts/cdjcv.js")
</head>
<body style="margin:5px 0px 0px 5px">
    <div style="font:bold 18pt verdana;">
        @ViewBag.Title
    </div>
    <hr style="border:solid 1px #000080; background:#000080" />
    <div>
        @{
            if (ViewBag.Viewer is Array)
            {
                // Display multiple charts
                for (int i = 0; i < ViewBag.Viewer.Length; ++i)
                {
                    @:@Html.Raw(ViewBag.Viewer[i].RenderHTML())
                }
            }
            else
            {
                // Display one chart only
                @:@Html.Raw(ViewBag.Viewer.RenderHTML())
            }
        }
    </div>
</body>
</html>
© 2023 Advanced Software Engineering Limited. All rights reserved.