[Windows Forms - C# version] NetWinCharts\CSharpWinCharts\markzone2.cs
using System;
using ChartDirector;
namespace CSharpChartExplorer
{
public class markzone2 : DemoModule
{
//Name of demo module
public string getName() { return "Marks and Zones (2)"; }
//Number of charts produced in this demo module
public int getNoOfCharts() { return 1; }
//Main code for creating chart.
//Note: the argument chartIndex is unused because this demo only has 1 chart.
public void createChart(WinChartViewer viewer, int chartIndex)
{
// The data for the chart
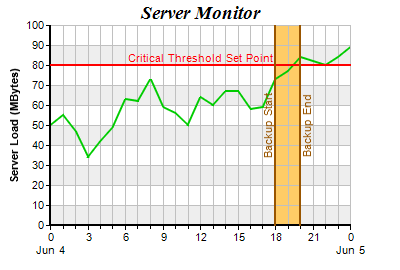
double[] data = {50, 55, 47, 34, 42, 49, 63, 62, 73, 59, 56, 50, 64, 60, 67, 67, 58, 59,
73, 77, 84, 82, 80, 84, 89};
// The labels for the chart. Note the "-" means a minor tick.
string[] labels = {"0\nJun 4", "1", "2", "3", "4", "5", "6", "7", "8", "9", "10", "11",
"12", "13", "14", "15", "16", "17", "18", "19", "20", "21", "22", "23", "0\nJun 5"};
// Create a XYChart object of size 400 x 270 pixels
XYChart c = new XYChart(400, 270);
// Set the plotarea at (80, 25) and of size 300 x 200 pixels. Use alternate color
// background (0xeeeeee) and (0xffffff). Set border and grid colors to grey (0xc0c0c0).
c.setPlotArea(50, 25, 300, 200, 0xeeeeee, 0xffffff, 0xc0c0c0, 0xc0c0c0, 0xc0c0c0);
// Add a title to the chart using 14pt Times Bold Italic font
c.addTitle("Server Monitor", "Times New Roman Bold Italic", 14);
// Add a title to the y axis
c.yAxis().setTitle("Server Load (MBytes)");
// Set the y axis width to 2 pixels
c.yAxis().setWidth(2);
// Set the labels on the x axis.
c.xAxis().setLabels(labels);
// Display 1 out of 3 labels on the x-axis. Show minor ticks for remaining labels.
c.xAxis().setLabelStep(3, 1);
// Set the x axis width to 2 pixels
c.xAxis().setWidth(2);
// Add a horizontal red (0x800080) mark line at y = 80
Mark yMark = c.yAxis().addMark(80, 0xff0000, "Critical Threshold Set Point");
// Set the mark line width to 2 pixels
yMark.setLineWidth(2);
// Put the mark label at the top center of the mark line
yMark.setAlignment(Chart.TopCenter);
// Add an orange (0xffcc66) zone from x = 18 to x = 20
c.xAxis().addZone(18, 20, 0xffcc66);
// Add a vertical brown (0x995500) mark line at x = 18
Mark xMark1 = c.xAxis().addMark(18, 0x995500, "Backup Start");
// Set the mark line width to 2 pixels
xMark1.setLineWidth(2);
// Put the mark label at the left of the mark line
xMark1.setAlignment(Chart.Left);
// Rotate the mark label by 90 degrees so it draws vertically
xMark1.setFontAngle(90);
// Add a vertical brown (0x995500) mark line at x = 20
Mark xMark2 = c.xAxis().addMark(20, 0x995500, "Backup End");
// Set the mark line width to 2 pixels
xMark2.setLineWidth(2);
// Put the mark label at the right of the mark line
xMark2.setAlignment(Chart.Right);
// Rotate the mark label by 90 degrees so it draws vertically
xMark2.setFontAngle(90);
// Add a green (0x00cc00) line layer with line width of 2 pixels
c.addLineLayer(data, 0x00cc00).setLineWidth(2);
// Output the chart
viewer.Chart = c;
//include tool tip for the chart
viewer.ImageMap = c.getHTMLImageMap("clickable", "",
"title='Load at {x}:00 = {value} MBytes'");
}
}
}
[Windows Forms - VB Version] NetWinCharts\VBNetWinCharts\markzone2.vb
Imports System
Imports Microsoft.VisualBasic
Imports ChartDirector

Public Class markzone2
    Implements DemoModule

    'Name of demo module
    Public Function getName() As String Implements DemoModule.getName
        Return "Marks and Zones (2)"
    End Function

    'Number of charts produced in this demo module
    Public Function getNoOfCharts() As Integer Implements DemoModule.getNoOfCharts
        Return 1
    End Function

    'Main code for creating chart.
    'Note: the argument chartIndex is unused because this demo only has 1 chart.
    Public Sub createChart(viewer As WinChartViewer, chartIndex As Integer) _
        Implements DemoModule.createChart

        ' The data for the chart
        Dim data() As Double = {50, 55, 47, 34, 42, 49, 63, 62, 73, 59, 56, 50, 64, 60, 67, 67, _
            58, 59, 73, 77, 84, 82, 80, 84, 89}

        ' The labels for the chart. Note the "-" means a minor tick.
        Dim labels() As String = {"0<*br*>Jun 4", "1", "2", "3", "4", "5", "6", "7", "8", "9", _
            "10", "11", "12", "13", "14", "15", "16", "17", "18", "19", "20", "21", "22", "23", _
            "0<*br*>Jun 5"}

        ' Create a XYChart object of size 400 x 270 pixels
        Dim c As XYChart = New XYChart(400, 270)

        ' Set the plotarea at (80, 25) and of size 300 x 200 pixels. Use alternate color background
        ' (0xeeeeee) and (0xffffff). Set border and grid colors to grey (0xc0c0c0).
        c.setPlotArea(50, 25, 300, 200, &Heeeeee, &Hffffff, &Hc0c0c0, &Hc0c0c0, &Hc0c0c0)

        ' Add a title to the chart using 14pt Times Bold Italic font
        c.addTitle("Server Monitor", "Times New Roman Bold Italic", 14)

        ' Add a title to the y axis
        c.yAxis().setTitle("Server Load (MBytes)")

        ' Set the y axis width to 2 pixels
        c.yAxis().setWidth(2)

        ' Set the labels on the x axis.
        c.xAxis().setLabels(labels)

        ' Display 1 out of 3 labels on the x-axis. Show minor ticks for remaining labels.
        c.xAxis().setLabelStep(3, 1)

        ' Set the x axis width to 2 pixels
        c.xAxis().setWidth(2)

        ' Add a horizontal red (0x800080) mark line at y = 80
        Dim yMark As Mark = c.yAxis().addMark(80, &Hff0000, "Critical Threshold Set Point")

        ' Set the mark line width to 2 pixels
        yMark.setLineWidth(2)

        ' Put the mark label at the top center of the mark line
        yMark.setAlignment(Chart.TopCenter)

        ' Add an orange (0xffcc66) zone from x = 18 to x = 20
        c.xAxis().addZone(18, 20, &Hffcc66)

        ' Add a vertical brown (0x995500) mark line at x = 18
        Dim xMark1 As Mark = c.xAxis().addMark(18, &H995500, "Backup Start")

        ' Set the mark line width to 2 pixels
        xMark1.setLineWidth(2)

        ' Put the mark label at the left of the mark line
        xMark1.setAlignment(Chart.Left)

        ' Rotate the mark label by 90 degrees so it draws vertically
        xMark1.setFontAngle(90)

        ' Add a vertical brown (0x995500) mark line at x = 20
        Dim xMark2 As Mark = c.xAxis().addMark(20, &H995500, "Backup End")

        ' Set the mark line width to 2 pixels
        xMark2.setLineWidth(2)

        ' Put the mark label at the right of the mark line
        xMark2.setAlignment(Chart.Right)

        ' Rotate the mark label by 90 degrees so it draws vertically
        xMark2.setFontAngle(90)

        ' Add a green (0x00cc00) line layer with line width of 2 pixels
        c.addLineLayer(data, &H00cc00).setLineWidth(2)

        ' Output the chart
        viewer.Chart = c

        'include tool tip for the chart
        viewer.ImageMap = c.getHTMLImageMap("clickable", "", _
            "title='Load at {x}:00 = {value} MBytes'")

    End Sub

End Class
[WPF - C#] NetWPFCharts\CSharpWPFCharts\markzone2.cs
using System;
using ChartDirector;

namespace CSharpWPFCharts
{
    public class markzone2 : DemoModule
    {
        //Name of demo module
        public string getName() { return "Marks and Zones (2)"; }

        //Number of charts produced in this demo module
        public int getNoOfCharts() { return 1; }

        //Main code for creating chart.
        //Note: the argument chartIndex is unused because this demo only has 1 chart.
        public void createChart(WPFChartViewer viewer, int chartIndex)
        {
            // The data for the chart
            double[] data = {50, 55, 47, 34, 42, 49, 63, 62, 73, 59, 56, 50, 64, 60, 67, 67, 58, 59,
                73, 77, 84, 82, 80, 84, 89};

            // The labels for the chart. Note the "-" means a minor tick.
            string[] labels = {"0\nJun 4", "1", "2", "3", "4", "5", "6", "7", "8", "9", "10", "11",
                "12", "13", "14", "15", "16", "17", "18", "19", "20", "21", "22", "23", "0\nJun 5"};

            // Create a XYChart object of size 400 x 270 pixels
            XYChart c = new XYChart(400, 270);

            // Set the plotarea at (80, 25) and of size 300 x 200 pixels. Use alternate color
            // background (0xeeeeee) and (0xffffff). Set border and grid colors to grey (0xc0c0c0).
            c.setPlotArea(50, 25, 300, 200, 0xeeeeee, 0xffffff, 0xc0c0c0, 0xc0c0c0, 0xc0c0c0);

            // Add a title to the chart using 14pt Times Bold Italic font
            c.addTitle("Server Monitor", "Times New Roman Bold Italic", 14);

            // Add a title to the y axis
            c.yAxis().setTitle("Server Load (MBytes)");

            // Set the y axis width to 2 pixels
            c.yAxis().setWidth(2);

            // Set the labels on the x axis.
            c.xAxis().setLabels(labels);

            // Display 1 out of 3 labels on the x-axis. Show minor ticks for remaining labels.
            c.xAxis().setLabelStep(3, 1);

            // Set the x axis width to 2 pixels
            c.xAxis().setWidth(2);

            // Add a horizontal red (0x800080) mark line at y = 80
            Mark yMark = c.yAxis().addMark(80, 0xff0000, "Critical Threshold Set Point");

            // Set the mark line width to 2 pixels
            yMark.setLineWidth(2);

            // Put the mark label at the top center of the mark line
            yMark.setAlignment(Chart.TopCenter);

            // Add an orange (0xffcc66) zone from x = 18 to x = 20
            c.xAxis().addZone(18, 20, 0xffcc66);

            // Add a vertical brown (0x995500) mark line at x = 18
            Mark xMark1 = c.xAxis().addMark(18, 0x995500, "Backup Start");

            // Set the mark line width to 2 pixels
            xMark1.setLineWidth(2);

            // Put the mark label at the left of the mark line
            xMark1.setAlignment(Chart.Left);

            // Rotate the mark label by 90 degrees so it draws vertically
            xMark1.setFontAngle(90);

            // Add a vertical brown (0x995500) mark line at x = 20
            Mark xMark2 = c.xAxis().addMark(20, 0x995500, "Backup End");

            // Set the mark line width to 2 pixels
            xMark2.setLineWidth(2);

            // Put the mark label at the right of the mark line
            xMark2.setAlignment(Chart.Right);

            // Rotate the mark label by 90 degrees so it draws vertically
            xMark2.setFontAngle(90);

            // Add a green (0x00cc00) line layer with line width of 2 pixels
            c.addLineLayer(data, 0x00cc00).setLineWidth(2);

            // Output the chart
            viewer.Chart = c;

            //include tool tip for the chart
            viewer.ImageMap = c.getHTMLImageMap("clickable", "",
                "title='Load at {x}:00 = {value} MBytes'");
        }
    }
}
[ASP.NET Web Forms - C# version] NetWebCharts\CSharpASP\markzone2.aspx
(Click here on how to convert this code to code-behind style.)<%@ Page Language="C#" Debug="true" %>
<%@ Import Namespace="ChartDirector" %>
<%@ Register TagPrefix="chart" Namespace="ChartDirector" Assembly="netchartdir" %>
<!DOCTYPE html>
<script runat="server">
//
// Page Load event handler
//
protected void Page_Load(object sender, EventArgs e)
{
// The data for the chart
double[] data = {50, 55, 47, 34, 42, 49, 63, 62, 73, 59, 56, 50, 64, 60, 67, 67, 58, 59, 73, 77,
84, 82, 80, 84, 89};
// The labels for the chart. Note the "-" means a minor tick.
string[] labels = {"0\nJun 4", "1", "2", "3", "4", "5", "6", "7", "8", "9", "10", "11", "12",
"13", "14", "15", "16", "17", "18", "19", "20", "21", "22", "23", "0\nJun 5"};
// Create a XYChart object of size 400 x 270 pixels
XYChart c = new XYChart(400, 270);
// Set the plotarea at (80, 25) and of size 300 x 200 pixels. Use alternate color background
// (0xeeeeee) and (0xffffff). Set border and grid colors to grey (0xc0c0c0).
c.setPlotArea(50, 25, 300, 200, 0xeeeeee, 0xffffff, 0xc0c0c0, 0xc0c0c0, 0xc0c0c0);
// Add a title to the chart using 14pt Times Bold Italic font
c.addTitle("Server Monitor", "Times New Roman Bold Italic", 14);
// Add a title to the y axis
c.yAxis().setTitle("Server Load (MBytes)");
// Set the y axis width to 2 pixels
c.yAxis().setWidth(2);
// Set the labels on the x axis.
c.xAxis().setLabels(labels);
// Display 1 out of 3 labels on the x-axis. Show minor ticks for remaining labels.
c.xAxis().setLabelStep(3, 1);
// Set the x axis width to 2 pixels
c.xAxis().setWidth(2);
// Add a horizontal red (0x800080) mark line at y = 80
Mark yMark = c.yAxis().addMark(80, 0xff0000, "Critical Threshold Set Point");
// Set the mark line width to 2 pixels
yMark.setLineWidth(2);
// Put the mark label at the top center of the mark line
yMark.setAlignment(Chart.TopCenter);
// Add an orange (0xffcc66) zone from x = 18 to x = 20
c.xAxis().addZone(18, 20, 0xffcc66);
// Add a vertical brown (0x995500) mark line at x = 18
Mark xMark1 = c.xAxis().addMark(18, 0x995500, "Backup Start");
// Set the mark line width to 2 pixels
xMark1.setLineWidth(2);
// Put the mark label at the left of the mark line
xMark1.setAlignment(Chart.Left);
// Rotate the mark label by 90 degrees so it draws vertically
xMark1.setFontAngle(90);
// Add a vertical brown (0x995500) mark line at x = 20
Mark xMark2 = c.xAxis().addMark(20, 0x995500, "Backup End");
// Set the mark line width to 2 pixels
xMark2.setLineWidth(2);
// Put the mark label at the right of the mark line
xMark2.setAlignment(Chart.Right);
// Rotate the mark label by 90 degrees so it draws vertically
xMark2.setFontAngle(90);
// Add a green (0x00cc00) line layer with line width of 2 pixels
c.addLineLayer(data, 0x00cc00).setLineWidth(2);
// Output the chart
WebChartViewer1.Image = c.makeWebImage(Chart.SVG);
// Include tool tip for the chart
WebChartViewer1.ImageMap = c.getHTMLImageMap("", "", "title='Load at {x}:00 = {value} MBytes'");
}
</script>
<html>
<head>
<script type="text/javascript" src="cdjcv.js"></script>
</head>
<body>
<chart:WebChartViewer id="WebChartViewer1" runat="server" />
</body>
</html>
[ASP.NET Web Forms - VB Version] NetWebCharts\VBNetASP\markzone2.aspx
(Click here on how to convert this code to code-behind style.)<%@ Page Language="VB" Debug="true" %>
<%@ Import Namespace="ChartDirector" %>
<%@ Register TagPrefix="chart" Namespace="ChartDirector" Assembly="netchartdir" %>
<!DOCTYPE html>
<script runat="server">
'
' Page Load event handler
'
Protected Sub Page_Load(ByVal sender As System.Object, ByVal e As System.EventArgs)
' The data for the chart
Dim data() As Double = {50, 55, 47, 34, 42, 49, 63, 62, 73, 59, 56, 50, 64, 60, 67, 67, 58, _
59, 73, 77, 84, 82, 80, 84, 89}
' The labels for the chart. Note the "-" means a minor tick.
Dim labels() As String = {"0<*br*>Jun 4", "1", "2", "3", "4", "5", "6", "7", "8", "9", "10", _
"11", "12", "13", "14", "15", "16", "17", "18", "19", "20", "21", "22", "23", _
"0<*br*>Jun 5"}
' Create a XYChart object of size 400 x 270 pixels
Dim c As XYChart = New XYChart(400, 270)
' Set the plotarea at (80, 25) and of size 300 x 200 pixels. Use alternate color background
' (0xeeeeee) and (0xffffff). Set border and grid colors to grey (0xc0c0c0).
c.setPlotArea(50, 25, 300, 200, &Heeeeee, &Hffffff, &Hc0c0c0, &Hc0c0c0, &Hc0c0c0)
' Add a title to the chart using 14pt Times Bold Italic font
c.addTitle("Server Monitor", "Times New Roman Bold Italic", 14)
' Add a title to the y axis
c.yAxis().setTitle("Server Load (MBytes)")
' Set the y axis width to 2 pixels
c.yAxis().setWidth(2)
' Set the labels on the x axis.
c.xAxis().setLabels(labels)
' Display 1 out of 3 labels on the x-axis. Show minor ticks for remaining labels.
c.xAxis().setLabelStep(3, 1)
' Set the x axis width to 2 pixels
c.xAxis().setWidth(2)
' Add a horizontal red (0x800080) mark line at y = 80
Dim yMark As Mark = c.yAxis().addMark(80, &Hff0000, "Critical Threshold Set Point")
' Set the mark line width to 2 pixels
yMark.setLineWidth(2)
' Put the mark label at the top center of the mark line
yMark.setAlignment(Chart.TopCenter)
' Add an orange (0xffcc66) zone from x = 18 to x = 20
c.xAxis().addZone(18, 20, &Hffcc66)
' Add a vertical brown (0x995500) mark line at x = 18
Dim xMark1 As Mark = c.xAxis().addMark(18, &H995500, "Backup Start")
' Set the mark line width to 2 pixels
xMark1.setLineWidth(2)
' Put the mark label at the left of the mark line
xMark1.setAlignment(Chart.Left)
' Rotate the mark label by 90 degrees so it draws vertically
xMark1.setFontAngle(90)
' Add a vertical brown (0x995500) mark line at x = 20
Dim xMark2 As Mark = c.xAxis().addMark(20, &H995500, "Backup End")
' Set the mark line width to 2 pixels
xMark2.setLineWidth(2)
' Put the mark label at the right of the mark line
xMark2.setAlignment(Chart.Right)
' Rotate the mark label by 90 degrees so it draws vertically
xMark2.setFontAngle(90)
' Add a green (0x00cc00) line layer with line width of 2 pixels
c.addLineLayer(data, &H00cc00).setLineWidth(2)
' Output the chart
WebChartViewer1.Image = c.makeWebImage(Chart.SVG)
' Include tool tip for the chart
WebChartViewer1.ImageMap = c.getHTMLImageMap("", "", "title='Load at {x}:00 = {value} MBytes'")
End Sub
</script>
<html>
<head>
<script type="text/javascript" src="cdjcv.js"></script>
</head>
<body>
<chart:WebChartViewer id="WebChartViewer1" runat="server" />
</body>
</html>
[ASP.NET MVC - Controller] NetMvcCharts\Controllers\Markzone2Controller.cs
using System;
using System.Web.Mvc;
using ChartDirector;

namespace NetMvcCharts.Controllers
{
    public class Markzone2Controller : Controller
    {
        //
        // Default Action
        //
        public ActionResult Index()
        {
            ViewBag.Title = "Marks and Zones (2)";
            createChart(ViewBag.Viewer = new RazorChartViewer(HttpContext, "chart1"));
            return View("~/Views/Shared/ChartView.cshtml");
        }

        //
        // Create chart
        //
        private void createChart(RazorChartViewer viewer)
        {
            // The data for the chart
            double[] data = {50, 55, 47, 34, 42, 49, 63, 62, 73, 59, 56, 50, 64, 60, 67, 67, 58, 59, 73,
                77, 84, 82, 80, 84, 89};

            // The labels for the chart. Note the "-" means a minor tick.
            string[] labels = {"0\nJun 4", "1", "2", "3", "4", "5", "6", "7", "8", "9", "10", "11", "12",
                "13", "14", "15", "16", "17", "18", "19", "20", "21", "22", "23", "0\nJun 5"};

            // Create a XYChart object of size 400 x 270 pixels
            XYChart c = new XYChart(400, 270);

            // Set the plotarea at (80, 25) and of size 300 x 200 pixels. Use alternate color background
            // (0xeeeeee) and (0xffffff). Set border and grid colors to grey (0xc0c0c0).
            c.setPlotArea(50, 25, 300, 200, 0xeeeeee, 0xffffff, 0xc0c0c0, 0xc0c0c0, 0xc0c0c0);

            // Add a title to the chart using 14pt Times Bold Italic font
            c.addTitle("Server Monitor", "Times New Roman Bold Italic", 14);

            // Add a title to the y axis
            c.yAxis().setTitle("Server Load (MBytes)");

            // Set the y axis width to 2 pixels
            c.yAxis().setWidth(2);

            // Set the labels on the x axis.
            c.xAxis().setLabels(labels);

            // Display 1 out of 3 labels on the x-axis. Show minor ticks for remaining labels.
            c.xAxis().setLabelStep(3, 1);

            // Set the x axis width to 2 pixels
            c.xAxis().setWidth(2);

            // Add a horizontal red (0x800080) mark line at y = 80
            Mark yMark = c.yAxis().addMark(80, 0xff0000, "Critical Threshold Set Point");

            // Set the mark line width to 2 pixels
            yMark.setLineWidth(2);

            // Put the mark label at the top center of the mark line
            yMark.setAlignment(Chart.TopCenter);

            // Add an orange (0xffcc66) zone from x = 18 to x = 20
            c.xAxis().addZone(18, 20, 0xffcc66);

            // Add a vertical brown (0x995500) mark line at x = 18
            Mark xMark1 = c.xAxis().addMark(18, 0x995500, "Backup Start");

            // Set the mark line width to 2 pixels
            xMark1.setLineWidth(2);

            // Put the mark label at the left of the mark line
            xMark1.setAlignment(Chart.Left);

            // Rotate the mark label by 90 degrees so it draws vertically
            xMark1.setFontAngle(90);

            // Add a vertical brown (0x995500) mark line at x = 20
            Mark xMark2 = c.xAxis().addMark(20, 0x995500, "Backup End");

            // Set the mark line width to 2 pixels
            xMark2.setLineWidth(2);

            // Put the mark label at the right of the mark line
            xMark2.setAlignment(Chart.Right);

            // Rotate the mark label by 90 degrees so it draws vertically
            xMark2.setFontAngle(90);

            // Add a green (0x00cc00) line layer with line width of 2 pixels
            c.addLineLayer(data, 0x00cc00).setLineWidth(2);

            // Output the chart
            viewer.Image = c.makeWebImage(Chart.SVG);

            // Include tool tip for the chart
            viewer.ImageMap = c.getHTMLImageMap("", "",
                "title='Load at {x}:00 = {value} MBytes'");
        }
    }
}
[ASP.NET MVC - View] NetMvcCharts\Views\Shared\ChartView.cshtml
@{ Layout = null; }

<!DOCTYPE html>

<html>
<head>
    <meta name="viewport" content="width=device-width" />
    <title>@ViewBag.Title</title>
    <style>
        @ViewBag.Style
    </style>
    @Scripts.Render("~/Scripts/cdjcv.js")
</head>
<body style="margin:5px 0px 0px 5px">
    <div style="font:bold 18pt verdana;">
        @ViewBag.Title
    </div>
    <hr style="border:solid 1px #000080; background:#000080" />
    <div>
        @{
            if (ViewBag.Viewer is Array)
            {
                // Display multiple charts
                for (int i = 0; i < ViewBag.Viewer.Length; ++i)
                {
                    @:@Html.Raw(ViewBag.Viewer[i].RenderHTML())
                }
            }
            else
            {
                // Display one chart only
                @:@Html.Raw(ViewBag.Viewer.RenderHTML())
            }
        }
    </div>
</body>
</html>
© 2023 Advanced Software Engineering Limited. All rights reserved.