[Windows Forms - C# version] NetWinCharts\CSharpWinCharts\frmmegarealtimezoomscroll.cs
using System;
using System.Windows.Forms;
using System.Collections.Generic;
using System.Threading.Tasks;
using System.Threading;
using System.Diagnostics;
using ChartDirector;
namespace CSharpChartExplorer
{
public partial class FrmMegaRealTimeZoomScroll : Form
{
public FrmMegaRealTimeZoomScroll()
{
InitializeComponent();
}
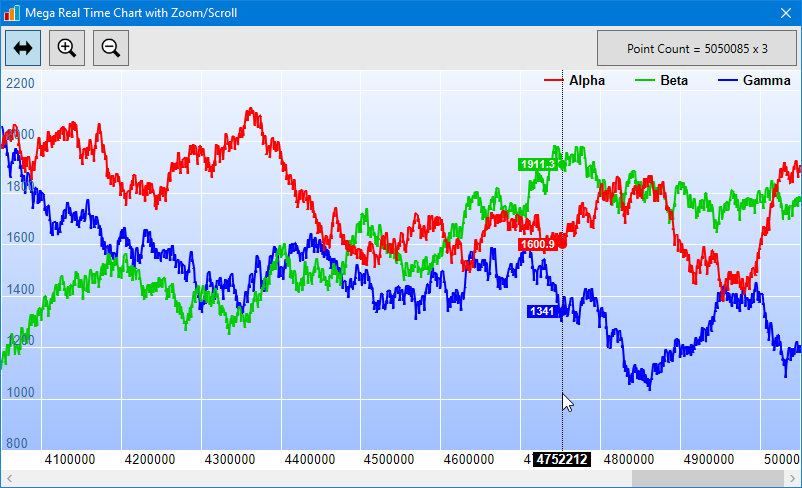
// In this example, we plot 3 real-time series, each with 10,000,000 points maximum.
// For demonstration purpose, we will pre-load half of the buffer with random data.
// The remaining half wlll be filled with real-time random data at a rate of 1000
// points per series per second.
private const int bufferSize = 10000000;
// Data arrays
private double[] timeStamps = new double[bufferSize];
private double[] dataSeriesA = new double[bufferSize];
private double[] dataSeriesB = new double[bufferSize];
private double[] dataSeriesC = new double[bufferSize];
// The index position that new data will be added.
private int currentIndex;
// Data Accelerator for handle large data sets
private DataAccelerator fastData;
// Flag to indicate the chart has been drawn so the zoom/scroll and track cursor
// event handlers can run.
private bool hasFinishedInitialization = false;
// The full x-axis range is at least 60 seconds (60000ms), and the maximum zooming
// is 10ms visible x-axis range.
private int minXRange = 60000;
private int zoomInLimit = 10;
// Real-time random number generator
private RanSeries realTimeData = new RanSeries(999);
private Stopwatch dataSourceEmulator = new Stopwatch();
private double lastTimeStamp = 0;
//
// For load event handler
//
private void FrmMegaRealTimeZoomScroll_Load(object sender, EventArgs e)
{
// Pre-load half of the buffer with random data
loadData();
// Display initial Message
PieChart c = new PieChart(800, 400, 0xd0e0ff);
c.addTitle(Chart.Center, "<*block,halign=left,maxwidth=500*>" +
"<*font=Arial Bold,size=18,underline=2*>Mega Real-Time Chart<*/font*><*br*><*br*>" +
"This example demonstrates a real time chart with huge amount of data. It contains " +
"3 lines pre-loaded with 5 million points each, then 1000 points are added to each " +
"line per second. We limit it to 3 x 10 million points so that it needs less than " +
"1G of RAM (320M to store the data, 600M to plot the data and handle the GUI)." +
"<*br*><*br*><*br*>Press the Plot Chart button to plot the chart.");
winChartViewer1.Image = c.makeImage();
}
//
// Pre-load half of the buffer with random data
//
private void loadData()
{
int initialSize = bufferSize / 2;
// To speed up random number generation, we use 3 threads to generate the random data
// for the 3 data series. The current thread is used for generating the timestamps.
List<Task> tasks = new List<Task>();
tasks.Add(Task.Factory.StartNew(() => {
new RanSeries(109).fillSeries2(dataSeriesA, 0, initialSize, 2500, -1, 1);
}));
tasks.Add(Task.Factory.StartNew(() => {
new RanSeries(110).fillSeries2(dataSeriesB, 0, initialSize, 2500, -1, 1);
}));
tasks.Add(Task.Factory.StartNew(() => {
new RanSeries(111).fillSeries2(dataSeriesC, 0, initialSize, 2500, -1, 1);
}));
new RanSeries(0).fillDateSeries(timeStamps, 0, initialSize, 0, 1);
currentIndex = initialSize;
Task.WaitAll(tasks.ToArray());
}
//
// User clicks on the Plot Chart pushbutton
//
private void plotChartPB_Click(object sender, EventArgs e)
{
if (hasFinishedInitialization)
return;
// This example uses a DataAccelerator to speed up the large amount of data. As we
// pre-load half of the buffer with random data, we need to process them first.
// To speed up, we create two threads to process two of the data series, and use the
// current thread to process the third series.
List<Task> tasks = new List<Task>();
fastData = new DataAccelerator(timeStamps, currentIndex);
tasks.Add(Task.Factory.StartNew(() => {
fastData.setDataSeries("mA", dataSeriesA);
}));
tasks.Add(Task.Factory.StartNew(() => {
fastData.setDataSeries("mB", dataSeriesB);
}));
fastData.setDataSeries("mC", dataSeriesC);
Task.WaitAll(tasks.ToArray());
// Initialize the WinChartViewer
initChartViewer(winChartViewer1);
hasFinishedInitialization = true;
// Trigger drawing of the initial chart
if (currentIndex > 0)
updateAxisScale(winChartViewer1);
else
winChartViewer1.updateViewPort(true, true);
// Start the realtime data generation timer and chart update timer
dataSourceEmulator.Start();
chartUpdateTimer.Start();
}
//
// Initialize the WinChartViewer
//
private void initChartViewer(WinChartViewer viewer)
{
if (currentIndex > 0)
{
// Set the full x range to be the data range, or at least minXRange.
double duration = Math.Max(timeStamps[currentIndex - 1] - timeStamps[0], minXRange);
viewer.setFullRange("x", timeStamps[0], timeStamps[0] + duration);
// Initialize the view port to show the latest 20% of the x range, or at least minXRange.
viewer.ViewPortWidth = Math.Max(0.2, minXRange / duration);
viewer.ViewPortLeft = 1 - viewer.ViewPortWidth;
// Set the maximum zoom to 10 x-units
viewer.ZoomInWidthLimit = Math.Min(1.0, zoomInLimit / duration);
}
else
{
viewer.ViewPortLeft = 0;
viewer.ViewPortWidth = 1;
}
// Enable mouse wheel zooming by setting the zoom ratio to 1.1 per wheel event
viewer.MouseWheelZoomRatio = 1.1;
// Initially set the mouse usage to Drag to Scroll mode
pointerPB.Checked = true;
viewer.MouseUsage = WinChartMouseUsage.ScrollOnDrag;
}
//
// Pointer (Drag to Scroll) button event handler
//
private void pointerPB_CheckedChanged(object sender, EventArgs e)
{
if (((RadioButton)sender).Checked)
winChartViewer1.MouseUsage = WinChartMouseUsage.ScrollOnDrag;
}
//
// Zoom In button event handler
//
private void zoomInPB_CheckedChanged(object sender, EventArgs e)
{
if (((RadioButton)sender).Checked)
winChartViewer1.MouseUsage = WinChartMouseUsage.ZoomIn;
}
//
// Zoom Out button event handler
//
private void zoomOutPB_CheckedChanged(object sender, EventArgs e)
{
if (((RadioButton)sender).Checked)
winChartViewer1.MouseUsage = WinChartMouseUsage.ZoomOut;
}
//
// The ViewPortChanged event handler. This event occurs if the user scrolls or zooms in
// or out the chart by dragging or clicking on the chart. It can also be triggered by
// calling WinChartViewer.updateViewPort.
//
private void winChartViewer1_ViewPortChanged(object sender, WinViewPortEventArgs e)
{
if (!hasFinishedInitialization)
return;
updateControls(winChartViewer1);
if (e.NeedUpdateChart)
drawChart(winChartViewer1);
}
//
// Update controls when the view port changed
//
private void updateControls(WinChartViewer viewer)
{
// Update the scroll bar to reflect the view port position and width of the view port.
hScrollBar1.Enabled = viewer.ViewPortWidth < 1;
hScrollBar1.LargeChange = (int)Math.Ceiling(viewer.ViewPortWidth *
(hScrollBar1.Maximum - hScrollBar1.Minimum));
hScrollBar1.SmallChange = (int)Math.Ceiling(hScrollBar1.LargeChange * 0.1);
hScrollBar1.Value = (int)Math.Round(viewer.ViewPortLeft *
(hScrollBar1.Maximum - hScrollBar1.Minimum)) + hScrollBar1.Minimum;
}
//
// Draw the chart and display it in the given viewer
//
private void drawChart(WinChartViewer viewer)
{
// Get the start date and end date that are visible on the chart.
double viewPortStartDate = viewer.getValueAtViewPort("x", viewer.ViewPortLeft);
double viewPortEndDate = viewer.getValueAtViewPort("x", viewer.ViewPortRight);
fastData.setSubsetRange(viewPortStartDate, viewPortEndDate);
//
// At this stage, we have extracted the visible data. We can use those data to plot the chart.
//
//================================================================================
// Configure overall chart appearance.
//================================================================================
XYChart c = new XYChart(800, 400);
// Set the plotarea at (0, 0) with width 1 pixel less than chart width, and height 20 pixels
// less than chart height. Use a vertical gradient from light blue (f0f6ff) to sky blue (a0c0ff)
// as background. Set border to transparent and grid lines to white (ffffff).
c.setPlotArea(0, 0, c.getWidth() - 1, c.getHeight() - 20, c.linearGradientColor(0, 0, 0,
c.getHeight() - 20, 0xf0f6ff, 0xa0c0ff), -1, Chart.Transparent, 0xffffff, 0xffffff);
// In our code, we can overdraw the line slightly, so we clip it to the plot area.
c.setClipping();
// Add a legend box at the right side using horizontal layout. Use 10pt Arial Bold as font. Set
// the background and border color to Transparent and use line style legend key.
LegendBox b = c.addLegend(c.getWidth() - 1, 10, false, "Arial Bold", 10);
b.setBackground(Chart.Transparent);
b.setAlignment(Chart.Right);
b.setLineStyleKey();
// Set the x and y axis stems to transparent and the label font to 10pt Arial
c.xAxis().setColors(Chart.Transparent);
c.yAxis().setColors(Chart.Transparent);
c.xAxis().setLabelStyle("Arial", 10);
c.yAxis().setLabelStyle("Arial", 10, 0x336699);
// Configure the y-axis label to be inside the plot area and above the horizontal grid lines
c.yAxis().setLabelGap(-1);
c.yAxis().setMargin(20);
c.yAxis().setLabelAlignment(1);
// Configure the x-axis labels to be to the left of the vertical grid lines
c.xAxis().setLabelAlignment(1);
//================================================================================
// Add data to chart
//================================================================================
// Add line layers using the DataAccelerator. Each layer only supports one accelerated
// series, so we add 3 layers for the 3 data series.
LineLayer layer = c.addLineLayer(fastData, "mA", 0xff0000, "Alpha");
layer.setLineWidth(2);
LineLayer layer2 = c.addLineLayer(fastData, "mB", 0x00cc00, "Beta");
layer2.setLineWidth(2);
LineLayer layer3 = c.addLineLayer(fastData, "mC", 0x0000ff, "Gamma");
layer3.setLineWidth(2);
//================================================================================
// Configure axis scale and labelling
//================================================================================
// Set the x-axis as a date/time axis with the scale according to the view port x range.
viewer.syncLinearAxisWithViewPort("x", c.xAxis());
// For the automatic axis labels, set the minimum spacing to 75/40 pixels for the x/y axis.
c.xAxis().setTickDensity(75);
c.yAxis().setTickDensity(40);
// Set the auto-scale margin to 0.05, and the zero affinity to 0.2
c.yAxis().setAutoScale(0.05, 0.05, 0.2);
//================================================================================
// Output the chart
//================================================================================
// We need to update the track line too. If the mouse is moving on the chart (eg. if
// the user drags the mouse on the chart to scroll it), the track line will be updated
// in the MouseMovePlotArea event. Otherwise, we need to update the track line here.
if ((!viewer.IsInMouseMoveEvent) && viewer.IsMouseOnPlotArea)
trackLineLabel(c, viewer.PlotAreaMouseX);
viewer.Chart = c;
}
//
// Draw track cursor when mouse is moving over plotarea
//
private void winChartViewer1_MouseMovePlotArea(object sender, MouseEventArgs e)
{
WinChartViewer viewer = (WinChartViewer)sender;
trackLineLabel((XYChart)viewer.Chart, viewer.PlotAreaMouseX);
viewer.updateDisplay();
// Hide the track cursor when the mouse leaves the plot area
viewer.removeDynamicLayer("MouseLeavePlotArea");
}
//
// Draw track line with data labels
//
private void trackLineLabel(XYChart c, int mouseX)
{
// Clear the current dynamic layer and get the DrawArea object to draw on it.
DrawArea d = c.initDynamicLayer();
// The plot area object
PlotArea plotArea = c.getPlotArea();
// Get the data x-value that is nearest to the mouse, and find its pixel coordinate.
double xValue = c.getNearestXValue(mouseX);
int xCoor = c.getXCoor(xValue);
// Draw a vertical track line at the x-position
d.vline(plotArea.getTopY(), plotArea.getBottomY(), xCoor, d.dashLineColor(0x000000, 0x0101));
// Draw a label on the x-axis to show the track line position.
string xlabel = "<*font,bgColor=000000*> " + xValue + " <*/font*>";
TTFText t = d.text(xlabel, "Arial Bold", 10);
// Restrict the x-pixel position of the label to make sure it stays inside the chart image.
int xLabelPos = Math.Max(0, Math.Min(xCoor - t.getWidth() / 2, c.getWidth() - t.getWidth()));
t.draw(xLabelPos, plotArea.getBottomY() + 2, 0xffffff);
// Iterate through all layers to draw the data labels
for (int i = 0; i < c.getLayerCount(); ++i)
{
Layer layer = c.getLayerByZ(i);
// The data array index of the x-value
int xIndex = layer.getXIndexOf(xValue);
// Iterate through all the data sets in the layer
for (int j = 0; j < layer.getDataSetCount(); ++j)
{
ChartDirector.DataSet dataSet = layer.getDataSetByZ(j);
// Get the color and position of the data label
int color = dataSet.getDataColor();
int yCoor = c.getYCoor(dataSet.getPosition(xIndex), dataSet.getUseYAxis());
// Draw a track dot with a label next to it for visible data points in the plot area
if ((yCoor >= plotArea.getTopY()) && (yCoor <= plotArea.getBottomY()) && (color !=
Chart.Transparent))
{
d.circle(xCoor, yCoor, 4, 4, color, color);
string label = "<*font,bgColor=" + color.ToString("x") + "*> " + c.formatValue(
dataSet.getValue(xIndex), "{value|P4}") + " <*/font*>";
t = d.text(label, "Arial Bold", 8);
// Draw the label on the right side of the dot if the mouse is on the left side the
// chart, and vice versa. This ensures the label will not go outside the chart image.
if (xCoor <= (plotArea.getLeftX() + plotArea.getRightX()) / 2)
t.draw(xCoor + 5, yCoor, 0xffffff, Chart.Left);
else
t.draw(xCoor - 5, yCoor, 0xffffff, Chart.Right);
}
}
}
}
private void hScrollBar1_ValueChanged(object sender, EventArgs e)
{
// When the view port is changed (user drags on the chart to scroll), the scroll bar will get
// updated. When the scroll bar changes (eg. user drags on the scroll bar), the view port will
// get updated. This creates an infinite loop. To avoid this, the scroll bar can update the
// view port only if the view port is not updating the scroll bar.
if (hasFinishedInitialization && !winChartViewer1.IsInViewPortChangedEvent)
{
// Set the view port based on the scroll bar
winChartViewer1.ViewPortLeft = ((double)(hScrollBar1.Value - hScrollBar1.Minimum))
/ (hScrollBar1.Maximum - hScrollBar1.Minimum);
// Trigger a view port changed event to update the chart
winChartViewer1.updateViewPort(true, false);
}
}
private void chartUpdateTimer_Tick(object sender, EventArgs e)
{
// Append real time data to the data arrays
if (getRealTimeData())
{
// Notify the DataAccelerator that new data are appended to the arrays, so it
// can accelerate them.
fastData.extendLength(currentIndex);
// We need to update the full x range to include the new data
updateAxisScale(winChartViewer1);
}
}
private bool getRealTimeData()
{
// In this example, we simulate a data source that can produced 3 x 1000 data points
// per second and store the data in a buffer. When the chart is updated, it will
// retrieve the data in the buffer.
// We determine the time elapsed since last chart update and assume there are already
// the requirement amount of data points in the buffer.
int pointCount = (int)(dataSourceEmulator.ElapsedMilliseconds - lastTimeStamp);
pointCount = Math.Min(pointCount, timeStamps.Length - currentIndex);
lastTimeStamp += pointCount;
// We append the data to the arrays
for (int i = currentIndex; i < currentIndex + pointCount; ++i)
timeStamps[i] = i;
if (currentIndex == 0)
{
// If the data arrays are empty, just generate some random data series.
realTimeData.fillSeries2(dataSeriesA, currentIndex, pointCount, 2500, -1, 1);
realTimeData.fillSeries2(dataSeriesB, currentIndex, pointCount, 2500, -1, 1);
realTimeData.fillSeries2(dataSeriesC, currentIndex, pointCount, 2500, -1, 1);
}
else
{
// If the data arrays are not empty, when append random data, ensure it starts from
// the last data point to make a continuous series.
--currentIndex;
++pointCount;
realTimeData.fillSeries2(dataSeriesA, currentIndex, pointCount, dataSeriesA[currentIndex], -1, 1);
realTimeData.fillSeries2(dataSeriesB, currentIndex, pointCount, dataSeriesB[currentIndex], -1, 1);
realTimeData.fillSeries2(dataSeriesC, currentIndex, pointCount, dataSeriesC[currentIndex], -1, 1);
}
currentIndex += pointCount;
// Displaying the point count in the pushbutton control to provide some feedback
plotChartPB.Text = "Point Count = " + currentIndex + " x 3";
// Return true if new data are available
return pointCount > 0;
}
//
// As we added more data, we may need to update the full range.
//
private void updateAxisScale(WinChartViewer viewer)
{
double startTime = timeStamps[0];
double endTime = timeStamps[currentIndex - 1];
// X-axis range must be at least equal the minXRange.
double duration = endTime - startTime;
if (duration < minXRange)
endTime = startTime + minXRange;
// Update the full range to reflect the actual duration of the data. In this case,
// if the view port is viewing the latest data, we will scroll the view port as new
// data are added. If the view port is viewing historical data, we would keep the
// axis scale unchanged to keep the chart stable.
int updateType = (viewer.ViewPortRight < 0.999) ? Chart.KeepVisibleRange :
Chart.ScrollWithMax;
bool axisScaleHasChanged = viewer.updateFullRangeH("x", startTime, endTime,
updateType);
// Set the zoom in limit as a ratio to the full range
viewer.ZoomInWidthLimit = zoomInLimit / (viewer.getValueAtViewPort("x", 1) -
viewer.getValueAtViewPort("x", 0));
// Trigger the viewPortChanged event to update the display if the axis scale has
// changed or if new data are added to the existing axis scale.
if (axisScaleHasChanged || (duration < minXRange))
viewer.updateViewPort(true, false);
}
}
}
[Windows Forms - VB Version] NetWinCharts\VBNetWinCharts\frmmegarealtimezoomscroll.vb
Imports ChartDirector
Imports System.Collections.Generic
Imports System.Threading.Tasks
Imports System.Threading

Public Class FrmMegaRealTimeZoomScroll

    ' In this example, we plot 3 real-time series, each with 10,000,000 points maximum.
    ' For demonstration purpose, we will pre-load half of the buffer with random data.
    ' The remaining half wlll be filled with real-time random data at a rate of 1000
    ' points per series per second.
    Private Const bufferSize As Integer = 10000000

    ' Data arrays
    Private timeStamps(bufferSize - 1) As Double
    Private dataSeriesA(bufferSize - 1) As Double
    Private dataSeriesB(bufferSize - 1) As Double
    Private dataSeriesC(bufferSize - 1) As Double

    ' The index position that New data will be added.
    Private currentIndex As Integer

    ' Data Accelerator for handle large data sets
    Private fastData As DataAccelerator

    ' Flag to indicate the chart has been drawn so the zoom/scroll And track cursor
    ' event handlers can run.
    Private hasFinishedInitialization As Boolean = False

    ' The full x-axis range Is at least 60 seconds (60000ms), And the maximum zooming
    ' Is 10ms visible x-axis range.
    Private minXRange As Integer = 60000
    Private zoomInLimit As Integer = 10

    ' Real-time random number generator
    Private realTimeData As RanSeries = New RanSeries(999)
    Private dataSourceEmulator As Stopwatch = New Stopwatch()
    Private lastTimeStamp As Double = 0

    '
    ' For load event handler
    '
    Private Sub FrmMegaRealTimeZoomScroll_Load(sender As Object, e As EventArgs) _
        Handles MyBase.Load

        ' Pre-load half of the buffer with random data
        loadData()

        ' Display initial Message
        Dim c As PieChart = New PieChart(800, 400, &HD0E0FF)
        c.addTitle(Chart.Center, "<*block,halign=left,maxwidth=500*>" &
            "<*font=Arial Bold,size=18,underline=2*>Mega Real-Time Chart<*/font*><*br*><*br*>" &
            "This example demonstrates a real time chart with huge amount of data. It contains " &
            "3 lines pre-loaded with 5 million points each, then 1000 points are added to each " &
            "line per second. We limit it to 3 x 10 million points so that it needs less than " &
            "1G of RAM (320M to store the data, 600M to plot the data and handle the GUI)." &
            "<*br*><*br*><*br*>Press the Plot Chart button to plot the chart.")
        winChartViewer1.Image = c.makeImage()

    End Sub

    '
    ' Pre-load half of the buffer with random data
    '
    Private Sub loadData()

        Dim initialSize As Integer = bufferSize / 2

        ' To speed up random number generation, we use 3 threads to generate the random data
        ' for the 3 data series. The current thread Is used for generating the timestamps.
        Dim tasks As New List(Of Task)

        tasks.Add(Task.Factory.StartNew(
            Sub()
                Dim rA As RanSeries = New RanSeries(109)
                rA.fillSeries2(dataSeriesA, 0, initialSize, 2500, -1, 1)
            End Sub
        ))
        tasks.Add(Task.Factory.StartNew(
            Sub()
                Dim rB As New RanSeries(110)
                rB.fillSeries2(dataSeriesB, 0, initialSize, 2500, -1, 1)
            End Sub
        ))
        tasks.Add(Task.Factory.StartNew(
            Sub()
                Dim rC As New RanSeries(111)
                rC.fillSeries2(dataSeriesC, 0, initialSize, 2500, -1, 1)
            End Sub
        ))

        Dim rT As New RanSeries(0)
        rT.fillDateSeries(timeStamps, 0, initialSize, 0, 1)
        currentIndex = initialSize

        Task.WaitAll(tasks.ToArray())

    End Sub

    '
    ' User clicks on the Plot Chart pushbutton
    '
    Private Sub plotChartPB_Click(sender As Object, e As EventArgs) Handles plotChartPB.Click

        If hasFinishedInitialization Then
            Exit Sub
        End If

        ' This example uses a DataAccelerator to speed up the large amount of data. As we
        ' pre-load half of the buffer with random data, we need to process them first.
        ' To speed up, we create two threads to process two of the data series, And use the
        ' current thread to process the third series.
        Dim tasks As New List(Of Task)

        fastData = New DataAccelerator(timeStamps, currentIndex)
        tasks.Add(Task.Factory.StartNew(
            Sub()
                fastData.setDataSeries("mA", dataSeriesA)
            End Sub
        ))
        tasks.Add(Task.Factory.StartNew(
            Sub()
                fastData.setDataSeries("mB", dataSeriesB)
            End Sub
        ))
        fastData.setDataSeries("mC", dataSeriesC)
        Task.WaitAll(tasks.ToArray())

        ' Initialize the WinChartViewer
        initChartViewer(winChartViewer1)
        hasFinishedInitialization = True

        ' Trigger drawing of the initial chart
        If currentIndex > 0 Then
            updateAxisScale(winChartViewer1)
        Else
            winChartViewer1.updateViewPort(True, True)
        End If

        ' Start the realtime data generation timer And chart update timer
        dataSourceEmulator.Start()
        chartUpdateTimer.Start()

    End Sub

    '
    ' Initialize the WinChartViewer
    '
    Private Sub initChartViewer(viewer As WinChartViewer)

        If currentIndex > 0 Then
            ' Set the full x range to be the data range, Or at least minXRange.
            Dim duration As Double = Math.Max(timeStamps(currentIndex - 1) - timeStamps(0), minXRange)
            viewer.setFullRange("x", timeStamps(0), timeStamps(0) + duration)

            ' Initialize the view port to show the latest 20% of the x range, Or at least minXRange.
            viewer.ViewPortWidth = Math.Max(0.2, minXRange / duration)
            viewer.ViewPortLeft = 1 - viewer.ViewPortWidth

            ' Set the maximum zoom to 10 x-units
            viewer.ZoomInWidthLimit = Math.Min(1.0, zoomInLimit / duration)
        Else
            viewer.ViewPortLeft = 0
            viewer.ViewPortWidth = 1
        End If

        ' Enable mouse wheel zooming by setting the zoom ratio to 1.1 per wheel event
        viewer.MouseWheelZoomRatio = 1.1

        ' Initially set the mouse usage to Drag to Scroll mode
        pointerPB.Checked = True

    End Sub

    '
    ' Pointer (Drag to Scroll) button event handler
    '
    Private Sub pointerPB_CheckedChanged(sender As Object, e As EventArgs) _
        Handles pointerPB.CheckedChanged

        If sender.Checked Then
            winChartViewer1.MouseUsage = WinChartMouseUsage.ScrollOnDrag
        End If

    End Sub

    '
    ' Zoom In button event handler
    '
    Private Sub zoomInPB_CheckedChanged(sender As Object, e As EventArgs) _
        Handles zoomInPB.CheckedChanged

        If sender.Checked Then
            winChartViewer1.MouseUsage = WinChartMouseUsage.ZoomIn
        End If

    End Sub

    '
    ' Zoom Out button event handler
    '
    Private Sub zoomOutPB_CheckedChanged(sender As Object, e As EventArgs) _
        Handles zoomOutPB.CheckedChanged

        If sender.Checked Then
            winChartViewer1.MouseUsage = WinChartMouseUsage.ZoomOut
        End If

    End Sub

    '
    ' The ViewPortChanged event handler. This event occurs if the user scrolls or zooms in
    ' or out the chart by dragging or clicking on the chart. It can also be triggered by
    ' calling WinChartViewer.updateViewPort.
    '
    Private Sub winChartViewer1_ViewPortChanged(sender As Object, e As WinViewPortEventArgs) _
        Handles winChartViewer1.ViewPortChanged

        If Not hasFinishedInitialization Then
            Exit Sub
        End If

        updateControls(winChartViewer1)

        If e.NeedUpdateChart Then
            drawChart(winChartViewer1)
        End If

    End Sub


    '
    ' Update controls when the view port changed
    '
    Private Sub updateControls(viewer As WinChartViewer)

        ' In this demo, we need to update the scroll bar to reflect the view port position and
        ' width of the view port.
        hScrollBar1.Enabled = viewer.ViewPortWidth < 1
        hScrollBar1.LargeChange = Math.Ceiling(viewer.ViewPortWidth *
            (hScrollBar1.Maximum - hScrollBar1.Minimum))
        hScrollBar1.SmallChange = Math.Ceiling(hScrollBar1.LargeChange * 0.1)
        hScrollBar1.Value = Math.Round(viewer.ViewPortLeft *
            (hScrollBar1.Maximum - hScrollBar1.Minimum)) + hScrollBar1.Minimum

    End Sub

    '
    ' The scroll bar event handler
    '
    Private Sub hScrollBar1_ValueChanged(sender As Object, e As EventArgs) _
        Handles hScrollBar1.ValueChanged

        ' When the view port is changed (user drags on the chart to scroll), the scroll bar will get
        ' updated. When the scroll bar changes (eg. user drags on the scroll bar), the view port will
        ' get updated. This creates an infinite loop. To avoid this, the scroll bar can update the
        ' view port only if the view port is not updating the scroll bar.
        If hasFinishedInitialization And Not winChartViewer1.IsInViewPortChangedEvent Then
            ' Set the view port based on the scroll bar
            winChartViewer1.ViewPortLeft = (hScrollBar1.Value - hScrollBar1.Minimum) /
                (hScrollBar1.Maximum - hScrollBar1.Minimum)

            ' Trigger a view port changed event to update the chart
            winChartViewer1.updateViewPort(True, False)
        End If

    End Sub

    '
    ' Draw the chart And display it in the given viewer
    '
    Private Sub drawChart(viewer As WinChartViewer)

        ' Get the start date and end date that are visible on the chart.
        Dim viewPortStartDate As Double = viewer.getValueAtViewPort("x", viewer.ViewPortLeft)
        Dim viewPortEndDate As Double = viewer.getValueAtViewPort("x", viewer.ViewPortRight)
        fastData.setSubsetRange(viewPortStartDate, viewPortEndDate)

        '
        ' At this stage, we have extracted the visible data. We can use those data to plot the chart.
        '

        '================================================================================
        ' Configure overall chart appearance.
        '================================================================================
        ' Create an XYChart object of size 800 x 400 pixels
        Dim c As XYChart = New XYChart(800, 400)

        ' Set the plotarea at (0, 0) with width 1 pixel less than chart width, And height 20 pixels
        ' less than chart height. Use a vertical gradient from light blue (f0f6ff) to sky blue (a0c0ff)
        ' as background. Set border to transparent And grid lines to white (ffffff).
        c.setPlotArea(0, 0, c.getWidth() - 1, c.getHeight() - 20, c.linearGradientColor(0, 0, 0,
            c.getHeight() - 20, &HF0F6FF, &HA0C0FF), -1, Chart.Transparent, &HFFFFFF, &HFFFFFF)

        ' As the data can lie outside the plotarea in a zoomed chart, we need enable clipping.
        c.setClipping()

        ' Add a legend box at the right side using horizontal layout. Use 10pt Arial Bold as font. Set
        ' the background And border color to Transparent And use line style legend key.
        Dim b As LegendBox = c.addLegend(c.getWidth() - 1, 10, False, "Arial Bold", 10)
        b.setBackground(Chart.Transparent)
        b.setAlignment(Chart.Right)
        b.setLineStyleKey()

        ' Set the x And y axis stems to transparent And the label font to 10pt Arial
        c.xAxis().setColors(Chart.Transparent)
        c.yAxis().setColors(Chart.Transparent)
        c.xAxis().setLabelStyle("Arial", 10)
        c.yAxis().setLabelStyle("Arial", 10, &H336699)

        ' Configure the y-axis label to be inside the plot area And above the horizontal grid lines
        c.yAxis().setLabelGap(-1)
        c.yAxis().setMargin(20)
        c.yAxis().setLabelAlignment(1)

        ' Configure the x-axis labels to be to the left of the vertical grid lines
        c.xAxis().setLabelAlignment(1)

        '================================================================================
        ' Add data to chart
        '================================================================================

        ' Add line layers using the DataAccelerator. Each layer only supports one accelerated
        ' series, so we add 3 layers for the 3 data series.

        ' Add a line layer for the lines, using a line width of 2 pixels
        Dim layer As LineLayer = c.addLineLayer(fastData, "mA", &HFF0000, "Alpha")
        layer.setLineWidth(2)

        Dim layer2 As LineLayer = c.addLineLayer(fastData, "mB", &HCC00, "Beta")
        layer2.setLineWidth(2)

        Dim layer3 As LineLayer = c.addLineLayer(fastData, "mC", &HFF, "Gamma")
        layer3.setLineWidth(2)

        '================================================================================
        ' Configure axis scale and labelling
        '================================================================================

        ' Set the x-axis as a date/time axis with the scale according to the view port x range.
        viewer.syncLinearAxisWithViewPort("x", c.xAxis())

        ' For the automatic axis labels, set the minimum spacing to 75/40 pixels for the x/y axis.
        c.xAxis().setTickDensity(75)
        c.yAxis().setTickDensity(40)

        ' Set the auto-scale margin to 0.05, And the zero affinity to 0.2
        c.yAxis().setAutoScale(0.05, 0.05, 0.2)

        '================================================================================
        ' Output the chart
        '================================================================================

        ' We need to update the track line too. If the mouse Is moving on the chart (eg. if
        ' the user drags the mouse on the chart to scroll it), the track line will be updated
        ' in the MouseMovePlotArea event. Otherwise, we need to update the track line here.
        If (Not viewer.IsInMouseMoveEvent) AndAlso viewer.IsMouseOnPlotArea Then
            trackLineLabel(c, viewer.PlotAreaMouseX)
        End If

        viewer.Chart = c

    End Sub

    '
    ' Draw track cursor when mouse is moving over plotarea
    '
    Private Sub winChartViewer1_MouseMovePlotArea(sender As Object, e As MouseEventArgs) _
        Handles winChartViewer1.MouseMovePlotArea

        If Not hasFinishedInitialization Then
            Exit Sub
        End If

        Dim viewer As WinChartViewer = sender
        trackLineLabel(viewer.Chart, viewer.PlotAreaMouseX)
        viewer.updateDisplay()

        ' Hide the track cursor when the mouse leaves the plot area
        viewer.removeDynamicLayer("MouseLeavePlotArea")

    End Sub

    '
    ' Draw track line with data labels
    '
    Private Sub trackLineLabel(c As XYChart, mouseX As Integer)

        ' Clear the current dynamic layer and get the DrawArea object to draw on it.
        Dim d As DrawArea = c.initDynamicLayer()

        ' The plot area object
        Dim plotArea As PlotArea = c.getPlotArea()

        ' Get the data x-value that is nearest to the mouse, and find its pixel coordinate.
        Dim xValue As Double = c.getNearestXValue(mouseX)
        Dim xCoor As Integer = c.getXCoor(xValue)

        ' Draw a vertical track line at the x-position
        d.vline(plotArea.getTopY(), plotArea.getBottomY(), xCoor, d.dashLineColor(&H0, &H101))

        ' Draw a label on the x-axis to show the track line position.
        Dim xlabel As String = "<*font,bgColor=000000*> " & xValue & " <*/font*>"
        Dim t As TTFText = d.text(xlabel, "Arial Bold", 10)

        ' Restrict the x-pixel position of the label to make sure it stays inside the chart image.
        Dim xLabelPos As Integer = Math.Max(0, Math.Min(xCoor - t.getWidth() / 2, c.getWidth() _
            - t.getWidth()))
        t.draw(xLabelPos, plotArea.getBottomY() + 2, &HFFFFFF)

        ' Iterate through all layers to draw the data labels
        For i As Integer = 0 To c.getLayerCount() - 1
            Dim layer As Layer = c.getLayerByZ(i)

            ' The data array index of the x-value
            Dim xIndex As Integer = layer.getXIndexOf(xValue)

            ' Iterate through all the data sets in the layer
            For j As Integer = 0 To layer.getDataSetCount() - 1
                Dim dataSet As ChartDirector.DataSet = layer.getDataSetByZ(j)

                ' Get the color and position of the data label
                Dim color As Integer = dataSet.getDataColor()
                Dim yCoor As Integer = c.getYCoor(dataSet.getPosition(xIndex), dataSet.getUseYAxis())

                ' Draw a track dot with a label next to it for visible data points in the plot area
                If (yCoor >= plotArea.getTopY()) And (yCoor <= plotArea.getBottomY()) And (color <>
                    Chart.Transparent) And (Not String.IsNullOrEmpty(dataSet.getDataName())) Then

                    d.circle(xCoor, yCoor, 4, 4, color, color)

                    Dim label As String = "<*font,bgColor=" & Hex(color) & "*> " & c.formatValue(
                        dataSet.getValue(xIndex), "{value|P4}") & " <*/font*>"
                    t = d.text(label, "Arial Bold", 8)

                    ' Draw the label on the right side of the dot if the mouse is on the left side the chart,
                    ' and vice versa. This ensures the label will not go outside the chart image.
                    If xCoor <= (plotArea.getLeftX() + plotArea.getRightX()) / 2 Then
                        t.draw(xCoor + 5, yCoor, &HFFFFFF, Chart.Left)
                    Else
                        t.draw(xCoor - 5, yCoor, &HFFFFFF, Chart.Right)
                    End If
                End If
            Next
        Next

    End Sub

    Private Sub chartUpdateTimer_Tick(sender As Object, e As EventArgs) _
        Handles chartUpdateTimer.Tick

        ' Append real time data to the data arrays
        If getRealTimeData() Then
            ' Notify the DataAccelerator that New data are appended to the arrays, so it
            ' can accelerate them.
            fastData.extendLength(currentIndex)

            ' We need to update the full x range to include the New data
            updateAxisScale(winChartViewer1)
        End If

    End Sub

    Private Function getRealTimeData() As Boolean

        ' In this example, we simulate a data source that can produced 3 x 1000 data points
        ' per second And store the data in a buffer. When the chart Is updated, it will
        ' retrieve the data in the buffer.

        ' We determine the time elapsed since last chart update And assume there are already
        ' the requirement amount of data points in the buffer.
        Dim pointCount As Integer = dataSourceEmulator.ElapsedMilliseconds - lastTimeStamp
        pointCount = Math.Min(pointCount, timeStamps.Length - currentIndex)
        lastTimeStamp += pointCount

        ' We append the data to the arrays
        For i As Integer = currentIndex To currentIndex + pointCount - 1
            timeStamps(i) = i
        Next

        If currentIndex = 0 Then
            ' If the data arrays are empty, just generate some random data series.
            realTimeData.fillSeries2(dataSeriesA, currentIndex, pointCount, 2500, -1, 1)
            realTimeData.fillSeries2(dataSeriesB, currentIndex, pointCount, 2500, -1, 1)
            realTimeData.fillSeries2(dataSeriesC, currentIndex, pointCount, 2500, -1, 1)
        Else
            ' If the data arrays are Not empty, when append random data, ensure it starts from
            ' the last data point to make a continuous series.

            currentIndex -= 1
            pointCount += 1

            realTimeData.fillSeries2(dataSeriesA, currentIndex, pointCount, dataSeriesA(currentIndex), -1, 1)
            realTimeData.fillSeries2(dataSeriesB, currentIndex, pointCount, dataSeriesB(currentIndex), -1, 1)
            realTimeData.fillSeries2(dataSeriesC, currentIndex, pointCount, dataSeriesC(currentIndex), -1, 1)
        End If

        currentIndex += pointCount

        ' Displaying the point count in the pushbutton control to provide some feedback
        plotChartPB.Text = "Point Count = " & currentIndex & " x 3"

        ' Return true if New data are available
        Return pointCount > 0

    End Function

    '
    ' As we added more data, we may need to update the full range.
    '
    Private Sub updateAxisScale(viewer As WinChartViewer)

        Dim startTime As Double = timeStamps(0)
        Dim endTime As Double = timeStamps(currentIndex - 1)

        ' X-axis range must be at least equal the minXRange.
        Dim duration As Double = endTime - startTime
        If duration < minXRange Then
            endTime = startTime + minXRange
        End If

        ' Update the full range to reflect the actual duration of the data. In this case,
        ' if the view port Is viewing the latest data, we will scroll the view port as New
        ' data are added. If the view port Is viewing historical data, we would keep the
        ' axis scale unchanged to keep the chart stable.
        Dim updateType As Integer = IIf(viewer.ViewPortRight < 0.999, Chart.KeepVisibleRange,
            Chart.ScrollWithMax)
        Dim axisScaleHasChanged As Boolean = viewer.updateFullRangeH("x", startTime, endTime,
            updateType)

        ' Set the zoom in limit as a ratio to the full range
        viewer.ZoomInWidthLimit = zoomInLimit / (viewer.getValueAtViewPort("x", 1) -
            viewer.getValueAtViewPort("x", 0))

        ' Trigger the viewPortChanged event to update the display if the axis scale has
        ' changed Or if New data are added to the existing axis scale.
        If axisScaleHasChanged Or duration < minXRange Then
            viewer.updateViewPort(True, False)
        End If

    End Sub

End Class
[WPF - XAML] NetWPFCharts\CSharpWPFCharts\MegaRealTimeZoomScrollWindow.xaml
<Window x:Class="CSharpWPFCharts.MegaRealTimeZoomScrollWindow"
        xmlns="http://schemas.microsoft.com/winfx/2006/xaml/presentation"
        xmlns:x="http://schemas.microsoft.com/winfx/2006/xaml"
        xmlns:d="http://schemas.microsoft.com/expression/blend/2008"
        xmlns:mc="http://schemas.openxmlformats.org/markup-compatibility/2006"
        xmlns:local="clr-namespace:CSharpWPFCharts"
        mc:Ignorable="d"
        xmlns:ChartDirector="clr-namespace:ChartDirector;assembly=netchartdir" UseLayoutRounding="True"
        Title="Mega Real Time Chart with Zoom/Scroll" Loaded="Window_Loaded" SizeToContent="WidthAndHeight" ResizeMode="NoResize"
        >
    <StackPanel>
        <DockPanel DockPanel.Dock="Top"  LastChildFill="False" Background="#FFE8E8E8">
            <RadioButton DockPanel.Dock="Left" x:Name="pointerPB" Style="{StaticResource {x:Type ToggleButton}}" Checked="pointerPB_Checked" Margin="4" >
                <Image Source="/icons/scroll_icon.png" Width="20" Height="20" Margin="6"/>
            </RadioButton>
            <RadioButton DockPanel.Dock="Left" x:Name="zoomInPB" Style="{StaticResource {x:Type ToggleButton}}" Checked="zoomInPB_Checked" Margin="4" >
                <Image Source="/icons/zoomin_icon.png" Width="20" Height="20" Margin="6"/>
            </RadioButton>
            <RadioButton DockPanel.Dock="Left" x:Name="zoomOutPB" Style="{StaticResource {x:Type ToggleButton}}" Checked="zoomOutPB_Checked" Margin="4" >
                <Image Source="/icons/zoomout_icon.png" Width="20" Height="20" Margin="6"/>
            </RadioButton>
            <Button DockPanel.Dock="Right" x:Name="plotChartPB" Content="Plot Chart" Width="200" Margin="4" Click="plotChartPB_Click"/>
        </DockPanel>
        <ChartDirector:WPFChartViewer x:Name="WPFChartViewer1" Width="800" Height="400" MouseMovePlotArea="WPFChartViewer1_MouseMovePlotArea"
            ViewPortChanged="WPFChartViewer1_ViewPortChanged" />
        <ScrollBar x:Name="hScrollBar1" Orientation="Horizontal" ValueChanged="hScrollBar1_ValueChanged" />
    </StackPanel>
</Window>
[WPF - C#] NetWPFCharts\CSharpWPFCharts\MegaRealTimeZoomScrollWindow.xaml.cs
using System;
using System.Windows;
using System.Windows.Input;
using System.Collections.Generic;
using System.Windows.Threading;
using System.Threading.Tasks;
using System.Diagnostics;
using ChartDirector;

namespace CSharpWPFCharts
{
    /// <summary>
    /// Interaction logic for MegaRealTimeZoomScroll.xaml
    /// </summary>
    public partial class MegaRealTimeZoomScrollWindow : Window
    {
        // In this example, we plot 3 real-time series, each with 10,000,000 points maximum.
        // For demonstration purpose, we will pre-load half of the buffer with random data.
        // The remaining half wlll be filled with real-time random data at a rate of 1000
        // points per series per second.
        private const int bufferSize = 10000000;

        // Data arrays
        private double[] timeStamps = new double[bufferSize];
        private double[] dataSeriesA = new double[bufferSize];
        private double[] dataSeriesB = new double[bufferSize];
        private double[] dataSeriesC = new double[bufferSize];

        // The index position that new data will be added.
        private int currentIndex;

        // Data Accelerator for handle large data sets
        private DataAccelerator fastData;

        // Flag to indicate the chart has been drawn so the zoom/scroll and track cursor
        // event handlers can run.
        private bool hasFinishedInitialization = false;

        // The full x-axis range is at least 60 seconds (60000ms), and the maximum zooming
        // is 10ms visible x-axis range.
        private int minXRange = 60000;
        private int zoomInLimit = 10;

        // Real-time random number generator
        private RanSeries realTimeData = new RanSeries(999);
        private Stopwatch dataSourceEmulator = new Stopwatch();
        private double lastTimeStamp = 0;

        // Timer used to updated the chart
        private DispatcherTimer chartUpdateTimer = new DispatcherTimer(DispatcherPriority.Render);

        public MegaRealTimeZoomScrollWindow()
        {
            InitializeComponent();
        }

        private void Window_Loaded(object sender, RoutedEventArgs e)
        {
            // Pre-load half of the buffer with random data
            loadData();

            // Display initial Message
            PieChart c = new PieChart(800, 400, 0xd0e0ff);
            c.addTitle(Chart.Center, "<*block,halign=left,maxwidth=500*>" +
                "<*font=Arial Bold,size=18,underline=2*>Mega Real-Time Chart<*/font*><*br*><*br*>" +
                "This example demonstrates a real time chart with huge amount of data. It contains " +
                "3 lines pre-loaded with 5 million points each, then 1000 points are added to each " +
                "line per second. We limit it to 3 x 10 million points so that it needs less than " +
                "1G of RAM (320M to store the data, 600M to plot the data and handle the GUI)." +
                "<*br*><*br*><*br*>Press the Plot Chart button to plot the chart.");
            WPFChartViewer1.Chart = c;

            // Chart update rate, which can be different from the data generation rate.
            chartUpdateTimer.Interval = new TimeSpan(0, 0, 0, 0, 100);
            chartUpdateTimer.Tick += chartUpdateTimer_Tick;

        }

        //
        // Generate random data
        //
        private void loadData()
        {
            int initialSize = bufferSize / 2;

            // To speed up random number generation, we use 3 threads to generate the random data
            // for the 3 data series. The current thread is used for generating the timestamps.
            List<Task> tasks = new List<Task>();

            tasks.Add(Task.Factory.StartNew(() => {
                new RanSeries(109).fillSeries2(dataSeriesA, 0, initialSize, 2500, -1, 1);
            }));
            tasks.Add(Task.Factory.StartNew(() => {
                new RanSeries(110).fillSeries2(dataSeriesB, 0, initialSize, 2500, -1, 1);
            }));
            tasks.Add(Task.Factory.StartNew(() => {
                new RanSeries(111).fillSeries2(dataSeriesC, 0, initialSize, 2500, -1, 1);
            }));

            new RanSeries(0).fillDateSeries(timeStamps, 0, initialSize, 0, 1);
            currentIndex = initialSize;

            Task.WaitAll(tasks.ToArray());
        }

        private void plotChartPB_Click(object sender, RoutedEventArgs e)
        {
            if (hasFinishedInitialization)
                return;

            // This example uses a DataAccelerator to speed up the large amount of data. As we
            // pre-load half of the buffer with random data, we need to process them first.
            // To speed up, we create two threads to process two of the data series, and use the
            // current thread to process the third series.
            List<Task> tasks = new List<Task>();

            fastData = new DataAccelerator(timeStamps, currentIndex);
            tasks.Add(Task.Factory.StartNew(() => {
                fastData.setDataSeries("mA", dataSeriesA);
            }));
            tasks.Add(Task.Factory.StartNew(() => {
                fastData.setDataSeries("mB", dataSeriesB);
            }));

            fastData.setDataSeries("mC", dataSeriesC);
            Task.WaitAll(tasks.ToArray());

            // Initialize the WinChartViewer
            initChartViewer(WPFChartViewer1);
            hasFinishedInitialization = true;

            WPFChartViewer1.updateViewPort(true, true);

            // Start the realtime data generation timer and chart update timer
            dataSourceEmulator.Start();
            chartUpdateTimer.Start();
        }

        //
        // Initialize the WinChartViewer
        //
        private void initChartViewer(WPFChartViewer viewer)
        {
            if (currentIndex > 0)
            {
                // Set the full x range to be the data range, or at least minXRange.
                double duration = Math.Max(timeStamps[currentIndex - 1] - timeStamps[0], minXRange);
                viewer.setFullRange("x", timeStamps[0], timeStamps[0] + duration);

                // Initialize the view port to show the latest 20% of the x range, or at least minXRange.
                viewer.ViewPortWidth = Math.Max(0.2, minXRange / duration);
                viewer.ViewPortLeft = 1 - viewer.ViewPortWidth;

                // Set the maximum zoom to 10 x-units
                viewer.ZoomInWidthLimit = Math.Min(1.0, zoomInLimit / duration);
            }
            else
            {
                viewer.ViewPortLeft = 0;
                viewer.ViewPortWidth = 1;
            }

            // Enable mouse wheel zooming by setting the zoom ratio to 1.1 per wheel event
            viewer.MouseWheelZoomRatio = 1.1;

            // Initially set the mouse usage to Drag to Scroll mode
            pointerPB.IsChecked = true;
        }

        //
        // Pointer (Drag to Scroll) button event handler
        //
        private void pointerPB_Checked(object sender, RoutedEventArgs e)
        {
            WPFChartViewer1.MouseUsage = WinChartMouseUsage.ScrollOnDrag;
        }

        //
        // Zoom In button event handler
        //
        private void zoomInPB_Checked(object sender, RoutedEventArgs e)
        {
            WPFChartViewer1.MouseUsage = WinChartMouseUsage.ZoomIn;
        }

        //
        // Zoom Out button event handler
        //
        private void zoomOutPB_Checked(object sender, RoutedEventArgs e)
        {
            WPFChartViewer1.MouseUsage = WinChartMouseUsage.ZoomOut;
        }

        //
        // The ViewPortChanged event handler. This event occurs if the user scrolls or zooms in
        // or out the chart by dragging or clicking on the chart. It can also be triggered by
        // calling WinChartViewer.updateViewPort.
        //
        private void WPFChartViewer1_ViewPortChanged(object sender, WPFViewPortEventArgs e)
        {
            if (!hasFinishedInitialization)
                return;

            // In addition to updating the chart, we may also need to update other controls that
            // changes based on the view port.
            updateControls(WPFChartViewer1);

            // Update the chart if necessary
            if (e.NeedUpdateChart)
                drawChart(WPFChartViewer1);
        }

        //
        // Update controls when the view port changed
        //
        private void updateControls(WPFChartViewer viewer)
        {
            // In this demo, we need to update the scroll bar to reflect the view port position and
            // width of the view port.
            hScrollBar1.IsEnabled = viewer.ViewPortWidth < 1;
            hScrollBar1.LargeChange = viewer.ViewPortWidth * (hScrollBar1.Maximum - hScrollBar1.Minimum);
            hScrollBar1.SmallChange = hScrollBar1.LargeChange * 0.1;
            hScrollBar1.ViewportSize = viewer.ViewPortWidth / Math.Max(1E-10, 1 - viewer.ViewPortWidth)
                * (hScrollBar1.Maximum - hScrollBar1.Minimum);
            hScrollBar1.Value = viewer.ViewPortLeft / Math.Max(1E-10, 1 - viewer.ViewPortWidth)
                * (hScrollBar1.Maximum - hScrollBar1.Minimum) + hScrollBar1.Minimum;
        }

        //
        // The scroll bar event handler
        //
        private void hScrollBar1_ValueChanged(object sender, RoutedPropertyChangedEventArgs<double> e)
        {
            var viewer = WPFChartViewer1;

            // When the view port is changed (user drags on the chart to scroll), the scroll bar will get
            // updated. When the scroll bar changes (eg. user drags on the scroll bar), the view port will
            // get updated. This creates an infinite loop. To avoid this, the scroll bar can update the
            // view port only if the view port is not updating the scroll bar.
            if (!viewer.IsInViewPortChangedEvent)
            {
                // Set the view port based on the scroll bar
                viewer.ViewPortLeft = (hScrollBar1.Value - hScrollBar1.Minimum)
                    / (hScrollBar1.Maximum - hScrollBar1.Minimum) * (1 - viewer.ViewPortWidth);

                // Trigger a view port changed event to update the chart
                viewer.updateViewPort(true, false);
            }
        }

        //
        // Draw the chart and display it in the given viewer
        //
        private void drawChart(WPFChartViewer viewer)
        {
            // Get the start date and end date that are visible on the chart.
            double viewPortStartDate = viewer.getValueAtViewPort("x", viewer.ViewPortLeft);
            double viewPortEndDate = viewer.getValueAtViewPort("x", viewer.ViewPortRight);
            fastData.setSubsetRange(viewPortStartDate, viewPortEndDate);

            //
            // At this stage, we have extracted the visible data. We can use those data to plot the chart.
            //

            //================================================================================
            // Configure overall chart appearance.
            //================================================================================

            XYChart c = new XYChart(800, 400);

            // Set the plotarea at (0, 0) with width 1 pixel less than chart width, and height 20 pixels
            // less than chart height. Use a vertical gradient from light blue (f0f6ff) to sky blue (a0c0ff)
            // as background. Set border to transparent and grid lines to white (ffffff).
            c.setPlotArea(0, 0, c.getWidth() - 1, c.getHeight() - 20, c.linearGradientColor(0, 0, 0,
                c.getHeight() - 20, 0xf0f6ff, 0xa0c0ff), -1, Chart.Transparent, 0xffffff, 0xffffff);

            // In our code, we can overdraw the line slightly, so we clip it to the plot area.
            c.setClipping();

            // Add a legend box at the right side using horizontal layout. Use 10pt Arial Bold as font. Set
            // the background and border color to Transparent and use line style legend key.
            LegendBox b = c.addLegend(c.getWidth() - 1, 10, false, "Arial Bold", 10);
            b.setBackground(Chart.Transparent);
            b.setAlignment(Chart.Right);
            b.setLineStyleKey();

            // Set the x and y axis stems to transparent and the label font to 10pt Arial
            c.xAxis().setColors(Chart.Transparent);
            c.yAxis().setColors(Chart.Transparent);
            c.xAxis().setLabelStyle("Arial", 10);
            c.yAxis().setLabelStyle("Arial", 10, 0x336699);

            // Configure the y-axis label to be inside the plot area and above the horizontal grid lines
            c.yAxis().setLabelGap(-1);
            c.yAxis().setMargin(20);
            c.yAxis().setLabelAlignment(1);

            // Configure the x-axis labels to be to the left of the vertical grid lines
            c.xAxis().setLabelAlignment(1);

            //================================================================================
            // Add data to chart
            //================================================================================

            // Add line layers using the DataAccelerator. Each layer only supports one accelerated
            // series, so we add 3 layers for the 3 data series.

            LineLayer layer = c.addLineLayer(fastData, "mA", 0xff0000, "Alpha");
            layer.setLineWidth(2);

            LineLayer layer2 = c.addLineLayer(fastData, "mB", 0x00cc00, "Beta");
            layer2.setLineWidth(2);

            LineLayer layer3 = c.addLineLayer(fastData, "mC", 0x0000ff, "Gamma");
            layer3.setLineWidth(2);

            //================================================================================
            // Configure axis scale and labelling
            //================================================================================

            // Set the x-axis as a date/time axis with the scale according to the view port x range.
            viewer.syncLinearAxisWithViewPort("x", c.xAxis());

            // For the automatic axis labels, set the minimum spacing to 75/40 pixels for the x/y axis.
            c.xAxis().setTickDensity(75);
            c.yAxis().setTickDensity(40);

            // Set the auto-scale margin to 0.05, and the zero affinity to 0.2
            c.yAxis().setAutoScale(0.05, 0.05, 0.2);

            //================================================================================
            // Output the chart
            //================================================================================

            // We need to update the track line too. If the mouse is moving on the chart (eg. if
            // the user drags the mouse on the chart to scroll it), the track line will be updated
            // in the MouseMovePlotArea event. Otherwise, we need to update the track line here.
            if ((!viewer.IsInMouseMoveEvent) && viewer.IsMouseOnPlotArea)
                trackLineLabel(c, viewer.PlotAreaMouseX);

            viewer.Chart = c;
        }

        //
        // Draw track cursor when mouse is moving over plotarea
        //
        private void WPFChartViewer1_MouseMovePlotArea(object sender, MouseEventArgs e)
        {
            if (!hasFinishedInitialization)
                return;

            WPFChartViewer viewer = (WPFChartViewer)sender;
            trackLineLabel((XYChart)viewer.Chart, viewer.PlotAreaMouseX);
            viewer.updateDisplay();

            // Hide the track cursor when the mouse leaves the plot area
            viewer.removeDynamicLayer("MouseLeavePlotArea");
        }

        //
        // Draw track line with data labels
        //
        private void trackLineLabel(XYChart c, int mouseX)
        {
            // Clear the current dynamic layer and get the DrawArea object to draw on it.
            DrawArea d = c.initDynamicLayer();

            // The plot area object
            PlotArea plotArea = c.getPlotArea();

            // Get the data x-value that is nearest to the mouse, and find its pixel coordinate.
            double xValue = c.getNearestXValue(mouseX);
            int xCoor = c.getXCoor(xValue);

            // Draw a vertical track line at the x-position
            d.vline(plotArea.getTopY(), plotArea.getBottomY(), xCoor, d.dashLineColor(0x000000, 0x0101));

            // Draw a label on the x-axis to show the track line position.
            string xlabel = "<*font,bgColor=000000*> " + xValue + " <*/font*>";
            TTFText t = d.text(xlabel, "Arial Bold", 10);

            // Restrict the x-pixel position of the label to make sure it stays inside the chart image.
            int xLabelPos = Math.Max(0, Math.Min(xCoor - t.getWidth() / 2, c.getWidth() - t.getWidth()));
            t.draw(xLabelPos, plotArea.getBottomY() + 2, 0xffffff);

            // Iterate through all layers to draw the data labels
            for (int i = 0; i < c.getLayerCount(); ++i)
            {
                Layer layer = c.getLayerByZ(i);

                // The data array index of the x-value
                int xIndex = layer.getXIndexOf(xValue);

                // Iterate through all the data sets in the layer
                for (int j = 0; j < layer.getDataSetCount(); ++j)
                {
                    ChartDirector.DataSet dataSet = layer.getDataSetByZ(j);

                    // Get the color and position of the data label
                    int color = dataSet.getDataColor();
                    int yCoor = c.getYCoor(dataSet.getPosition(xIndex), dataSet.getUseYAxis());

                    // Draw a track dot with a label next to it for visible data points in the plot area
                    if ((yCoor >= plotArea.getTopY()) && (yCoor <= plotArea.getBottomY()) && (color !=
                        Chart.Transparent))
                    {
                        d.circle(xCoor, yCoor, 4, 4, color, color);

                        string label = "<*font,bgColor=" + color.ToString("x") + "*> " + c.formatValue(
                            dataSet.getValue(xIndex), "{value|P4}") + " <*/font*>";
                        t = d.text(label, "Arial Bold", 8);

                        // Draw the label on the right side of the dot if the mouse is on the left side the
                        // chart, and vice versa. This ensures the label will not go outside the chart image.
                        if (xCoor <= (plotArea.getLeftX() + plotArea.getRightX()) / 2)
                            t.draw(xCoor + 5, yCoor, 0xffffff, Chart.Left);
                        else
                            t.draw(xCoor - 5, yCoor, 0xffffff, Chart.Right);
                    }
                }
            }
        }

        //
        // The chartUpdateTimer Tick event - this updates the chart periodicially by raising
        // viewPortChanged events.
        //
        private void chartUpdateTimer_Tick(object sender, EventArgs e)
        {
            // Append real time data to the data arrays
            if (getRealTimeData())
            {
                // Notify the DataAccelerator that new data are appended to the arrays, so it
                // can accelerate them.
                fastData.extendLength(currentIndex);

                // We need to update the full x range to include the new data
                updateAxisScale(WPFChartViewer1);
            }
        }

        private bool getRealTimeData()
        {
            // In this example, we simulate a data source that can produced 3 x 1000 data points
            // per second and store the data in a buffer. When the chart is updated, it will
            // retrieve the data in the buffer.

            // We determine the time elapsed since last chart update and assume there are already
            // the requirement amount of data points in the buffer.
            int pointCount = (int)(dataSourceEmulator.ElapsedMilliseconds - lastTimeStamp);
            pointCount = Math.Min(pointCount, timeStamps.Length - currentIndex);
            lastTimeStamp += pointCount;

            // We append the data to the arrays
            for (int i = currentIndex; i < currentIndex + pointCount; ++i)
                timeStamps[i] = i;

            if (currentIndex == 0)
            {
                // If the data arrays are empty, just generate some random data series.
                realTimeData.fillSeries2(dataSeriesA, currentIndex, pointCount, 2500, -1, 1);
                realTimeData.fillSeries2(dataSeriesB, currentIndex, pointCount, 2500, -1, 1);
                realTimeData.fillSeries2(dataSeriesC, currentIndex, pointCount, 2500, -1, 1);
            }
            else
            {
                // If the data arrays are not empty, when append random data, ensure it starts from
                // the last data point to make a continuous series.

                --currentIndex;
                ++pointCount;

                realTimeData.fillSeries2(dataSeriesA, currentIndex, pointCount, dataSeriesA[currentIndex], -1, 1);
                realTimeData.fillSeries2(dataSeriesB, currentIndex, pointCount, dataSeriesB[currentIndex], -1, 1);
                realTimeData.fillSeries2(dataSeriesC, currentIndex, pointCount, dataSeriesC[currentIndex], -1, 1);
            }

            currentIndex += pointCount;

            // Displaying the point count in the pushbutton control to provide some feedback
            plotChartPB.Content = "Point Count = " + currentIndex + " x 3";

            // Return true if new data are available
            return pointCount > 0;
        }

        //
        // As we added more data, we may need to update the full range.
        //
        private void updateAxisScale(WPFChartViewer viewer)
        {
            double startTime = timeStamps[0];
            double endTime = timeStamps[currentIndex - 1];

            // X-axis range must be at least equal the minXRange.
            double duration = endTime - startTime;
            if (duration < minXRange)
                endTime = startTime + minXRange;

            // Update the full range to reflect the actual duration of the data. In this case,
            // if the view port is viewing the latest data, we will scroll the view port as new
            // data are added. If the view port is viewing historical data, we would keep the
            // axis scale unchanged to keep the chart stable.
            int updateType = (viewer.ViewPortRight < 0.999) ? Chart.KeepVisibleRange :
                Chart.ScrollWithMax;
            bool axisScaleHasChanged = viewer.updateFullRangeH("x", startTime, endTime,
                updateType);

            // Set the zoom in limit as a ratio to the full range
            viewer.ZoomInWidthLimit = zoomInLimit / (viewer.getValueAtViewPort("x", 1) -
                viewer.getValueAtViewPort("x", 0));

            // Trigger the viewPortChanged event to update the display if the axis scale has
            // changed or if new data are added to the existing axis scale.
            if (axisScaleHasChanged || (duration < minXRange))
                viewer.updateViewPort(true, false);
        }
    }
}
© 2023 Advanced Software Engineering Limited. All rights reserved.