[Windows Forms - C# version] NetWinCharts\CSharpWinCharts\missingpoints.cs
using System;
using ChartDirector;
namespace CSharpChartExplorer
{
public class missingpoints : DemoModule
{
//Name of demo module
public string getName() { return "Missing Data Points"; }
//Number of charts produced in this demo module
public int getNoOfCharts() { return 1; }
//Main code for creating chart.
//Note: the argument chartIndex is unused because this demo only has 1 chart.
public void createChart(WinChartViewer viewer, int chartIndex)
{
// The data for the chart
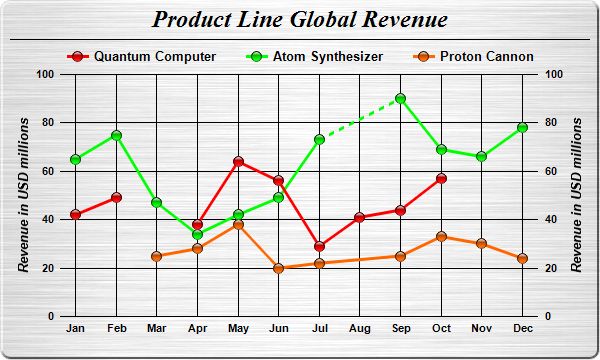
double[] data0 = {42, 49, Chart.NoValue, 38, 64, 56, 29, 41, 44, 57};
double[] data1 = {65, 75, 47, 34, 42, 49, 73, Chart.NoValue, 90, 69, 66, 78};
double[] data2 = {Chart.NoValue, Chart.NoValue, 25, 28, 38, 20, 22, Chart.NoValue, 25,
33, 30, 24};
string[] labels = {"Jan", "Feb", "Mar", "Apr", "May", "Jun", "Jul", "Aug", "Sep", "Oct",
"Nov", "Dec"};
// Create a XYChart object of size 600 x 360 pixels. Set background color to brushed
// silver, with a 2 pixel 3D border. Use rounded corners.
XYChart c = new XYChart(600, 360, Chart.brushedSilverColor(), Chart.Transparent, 2);
c.setRoundedFrame();
// Add a title using 18pt Times New Roman Bold Italic font. #Set top/bottom margins to 6
// pixels.
ChartDirector.TextBox title = c.addTitle("Product Line Global Revenue",
"Times New Roman Bold Italic", 18);
title.setMargin2(0, 0, 6, 6);
// Add a separator line just under the title
c.addLine(10, title.getHeight(), c.getWidth() - 11, title.getHeight(), Chart.LineColor);
// Add a legend box where the top-center is anchored to the horizontal center of the
// chart, just under the title. Use horizontal layout and 10 points Arial Bold font, and
// transparent background and border.
LegendBox legendBox = c.addLegend(c.getWidth() / 2, title.getHeight(), false,
"Arial Bold", 10);
legendBox.setAlignment(Chart.TopCenter);
legendBox.setBackground(Chart.Transparent, Chart.Transparent);
// Tentatively set the plotarea at (70, 75) and of 460 x 240 pixels in size. Use
// transparent border and black (000000) grid lines
c.setPlotArea(70, 75, 460, 240, -1, -1, Chart.Transparent, 0x000000, -1);
// Set the x axis labels
c.xAxis().setLabels(labels);
// Show the same scale on the left and right y-axes
c.syncYAxis();
// Set y-axis tick density to 30 pixels. ChartDirector auto-scaling will use this as the
// guideline when putting ticks on the y-axis.
c.yAxis().setTickDensity(30);
// Set all axes to transparent
c.xAxis().setColors(Chart.Transparent);
c.yAxis().setColors(Chart.Transparent);
c.yAxis2().setColors(Chart.Transparent);
// Set the x-axis margins to 15 pixels, so that the horizontal grid lines can extend
// beyond the leftmost and rightmost vertical grid lines
c.xAxis().setMargin(15, 15);
// Set axis label style to 8pt Arial Bold
c.xAxis().setLabelStyle("Arial Bold", 8);
c.yAxis().setLabelStyle("Arial Bold", 8);
c.yAxis2().setLabelStyle("Arial Bold", 8);
// Add axis title using 10pt Arial Bold Italic font
c.yAxis().setTitle("Revenue in USD millions", "Arial Bold Italic", 10);
c.yAxis2().setTitle("Revenue in USD millions", "Arial Bold Italic", 10);
// Add the first line. The missing data will be represented as gaps in the line (the
// default behaviour)
LineLayer layer0 = c.addLineLayer2();
layer0.addDataSet(data0, 0xff0000, "Quantum Computer").setDataSymbol(
Chart.GlassSphere2Shape, 11);
layer0.setLineWidth(3);
// Add the second line. The missing data will be represented by using dash lines to
// bridge the gap
LineLayer layer1 = c.addLineLayer2();
layer1.addDataSet(data1, 0x00ff00, "Atom Synthesizer").setDataSymbol(
Chart.GlassSphere2Shape, 11);
layer1.setLineWidth(3);
layer1.setGapColor(c.dashLineColor(0x00ff00));
// Add the third line. The missing data will be ignored - just join the gap with the
// original line style.
LineLayer layer2 = c.addLineLayer2();
layer2.addDataSet(data2, 0xff6600, "Proton Cannon").setDataSymbol(
Chart.GlassSphere2Shape, 11);
layer2.setLineWidth(3);
layer2.setGapColor(Chart.SameAsMainColor);
// layout the legend so we can get the height of the legend box
c.layoutLegend();
// Adjust the plot area size, such that the bounding box (inclusive of axes) is 15
// pixels from the left edge, just under the legend box, 16 pixels from the right edge,
// and 25 pixels from the bottom edge.
c.packPlotArea(15, legendBox.getTopY() + legendBox.getHeight(), c.getWidth() - 16,
c.getHeight() - 25);
// Output the chart
viewer.Chart = c;
//include tool tip for the chart
viewer.ImageMap = c.getHTMLImageMap("clickable", "",
"title='Revenue of {dataSetName} in {xLabel}: US$ {value}M'");
}
}
}
[Windows Forms - VB Version] NetWinCharts\VBNetWinCharts\missingpoints.vb
Imports System
Imports Microsoft.VisualBasic
Imports ChartDirector

Public Class missingpoints
    Implements DemoModule

    'Name of demo module
    Public Function getName() As String Implements DemoModule.getName
        Return "Missing Data Points"
    End Function

    'Number of charts produced in this demo module
    Public Function getNoOfCharts() As Integer Implements DemoModule.getNoOfCharts
        Return 1
    End Function

    'Main code for creating chart.
    'Note: the argument chartIndex is unused because this demo only has 1 chart.
    Public Sub createChart(viewer As WinChartViewer, chartIndex As Integer) _
        Implements DemoModule.createChart

        ' The data for the chart
        Dim data0() As Double = {42, 49, Chart.NoValue, 38, 64, 56, 29, 41, 44, 57}
        Dim data1() As Double = {65, 75, 47, 34, 42, 49, 73, Chart.NoValue, 90, 69, 66, 78}
        Dim data2() As Double = {Chart.NoValue, Chart.NoValue, 25, 28, 38, 20, 22, Chart.NoValue, _
            25, 33, 30, 24}
        Dim labels() As String = {"Jan", "Feb", "Mar", "Apr", "May", "Jun", "Jul", "Aug", "Sep", _
            "Oct", "Nov", "Dec"}

        ' Create a XYChart object of size 600 x 360 pixels. Set background color to brushed silver,
        ' with a 2 pixel 3D border. Use rounded corners.
        Dim c As XYChart = New XYChart(600, 360, Chart.brushedSilverColor(), Chart.Transparent, 2)
        c.setRoundedFrame()

        ' Add a title using 18pt Times New Roman Bold Italic font. #Set top/bottom margins to 6
        ' pixels.
        Dim title As ChartDirector.TextBox = c.addTitle("Product Line Global Revenue", _
            "Times New Roman Bold Italic", 18)
        title.setMargin2(0, 0, 6, 6)

        ' Add a separator line just under the title
        c.addLine(10, title.getHeight(), c.getWidth() - 11, title.getHeight(), Chart.LineColor)

        ' Add a legend box where the top-center is anchored to the horizontal center of the chart,
        ' just under the title. Use horizontal layout and 10 points Arial Bold font, and transparent
        ' background and border.
        Dim legendBox As LegendBox = c.addLegend(c.getWidth() / 2, title.getHeight(), False, _
            "Arial Bold", 10)
        legendBox.setAlignment(Chart.TopCenter)
        legendBox.setBackground(Chart.Transparent, Chart.Transparent)

        ' Tentatively set the plotarea at (70, 75) and of 460 x 240 pixels in size. Use transparent
        ' border and black (000000) grid lines
        c.setPlotArea(70, 75, 460, 240, -1, -1, Chart.Transparent, &H000000, -1)

        ' Set the x axis labels
        c.xAxis().setLabels(labels)

        ' Show the same scale on the left and right y-axes
        c.syncYAxis()

        ' Set y-axis tick density to 30 pixels. ChartDirector auto-scaling will use this as the
        ' guideline when putting ticks on the y-axis.
        c.yAxis().setTickDensity(30)

        ' Set all axes to transparent
        c.xAxis().setColors(Chart.Transparent)
        c.yAxis().setColors(Chart.Transparent)
        c.yAxis2().setColors(Chart.Transparent)

        ' Set the x-axis margins to 15 pixels, so that the horizontal grid lines can extend beyond
        ' the leftmost and rightmost vertical grid lines
        c.xAxis().setMargin(15, 15)

        ' Set axis label style to 8pt Arial Bold
        c.xAxis().setLabelStyle("Arial Bold", 8)
        c.yAxis().setLabelStyle("Arial Bold", 8)
        c.yAxis2().setLabelStyle("Arial Bold", 8)

        ' Add axis title using 10pt Arial Bold Italic font
        c.yAxis().setTitle("Revenue in USD millions", "Arial Bold Italic", 10)
        c.yAxis2().setTitle("Revenue in USD millions", "Arial Bold Italic", 10)

        ' Add the first line. The missing data will be represented as gaps in the line (the default
        ' behaviour)
        Dim layer0 As LineLayer = c.addLineLayer2()
        layer0.addDataSet(data0, &Hff0000, "Quantum Computer").setDataSymbol( _
            Chart.GlassSphere2Shape, 11)
        layer0.setLineWidth(3)

        ' Add the second line. The missing data will be represented by using dash lines to bridge
        ' the gap
        Dim layer1 As LineLayer = c.addLineLayer2()
        layer1.addDataSet(data1, &H00ff00, "Atom Synthesizer").setDataSymbol( _
            Chart.GlassSphere2Shape, 11)
        layer1.setLineWidth(3)
        layer1.setGapColor(c.dashLineColor(&H00ff00))

        ' Add the third line. The missing data will be ignored - just join the gap with the original
        ' line style.
        Dim layer2 As LineLayer = c.addLineLayer2()
        layer2.addDataSet(data2, &Hff6600, "Proton Cannon").setDataSymbol(Chart.GlassSphere2Shape, _
            11)
        layer2.setLineWidth(3)
        layer2.setGapColor(Chart.SameAsMainColor)

        ' layout the legend so we can get the height of the legend box
        c.layoutLegend()

        ' Adjust the plot area size, such that the bounding box (inclusive of axes) is 15 pixels
        ' from the left edge, just under the legend box, 16 pixels from the right edge, and 25
        ' pixels from the bottom edge.
        c.packPlotArea(15, legendBox.getTopY() + legendBox.getHeight(), c.getWidth() - 16, _
            c.getHeight() - 25)

        ' Output the chart
        viewer.Chart = c

        'include tool tip for the chart
        viewer.ImageMap = c.getHTMLImageMap("clickable", "", _
            "title='Revenue of {dataSetName} in {xLabel}: US$ {value}M'")

    End Sub

End Class
[WPF - C#] NetWPFCharts\CSharpWPFCharts\missingpoints.cs
using System;
using ChartDirector;

namespace CSharpWPFCharts
{
    public class missingpoints : DemoModule
    {
        //Name of demo module
        public string getName() { return "Missing Data Points"; }

        //Number of charts produced in this demo module
        public int getNoOfCharts() { return 1; }

        //Main code for creating chart.
        //Note: the argument chartIndex is unused because this demo only has 1 chart.
        public void createChart(WPFChartViewer viewer, int chartIndex)
        {
            // The data for the chart
            double[] data0 = {42, 49, Chart.NoValue, 38, 64, 56, 29, 41, 44, 57};
            double[] data1 = {65, 75, 47, 34, 42, 49, 73, Chart.NoValue, 90, 69, 66, 78};
            double[] data2 = {Chart.NoValue, Chart.NoValue, 25, 28, 38, 20, 22, Chart.NoValue, 25,
                33, 30, 24};
            string[] labels = {"Jan", "Feb", "Mar", "Apr", "May", "Jun", "Jul", "Aug", "Sep", "Oct",
                "Nov", "Dec"};

            // Create a XYChart object of size 600 x 360 pixels. Set background color to brushed
            // silver, with a 2 pixel 3D border. Use rounded corners.
            XYChart c = new XYChart(600, 360, Chart.brushedSilverColor(), Chart.Transparent, 2);
            c.setRoundedFrame();

            // Add a title using 18pt Times New Roman Bold Italic font. #Set top/bottom margins to 6
            // pixels.
            ChartDirector.TextBox title = c.addTitle("Product Line Global Revenue",
                "Times New Roman Bold Italic", 18);
            title.setMargin2(0, 0, 6, 6);

            // Add a separator line just under the title
            c.addLine(10, title.getHeight(), c.getWidth() - 11, title.getHeight(), Chart.LineColor);

            // Add a legend box where the top-center is anchored to the horizontal center of the
            // chart, just under the title. Use horizontal layout and 10 points Arial Bold font, and
            // transparent background and border.
            LegendBox legendBox = c.addLegend(c.getWidth() / 2, title.getHeight(), false,
                "Arial Bold", 10);
            legendBox.setAlignment(Chart.TopCenter);
            legendBox.setBackground(Chart.Transparent, Chart.Transparent);

            // Tentatively set the plotarea at (70, 75) and of 460 x 240 pixels in size. Use
            // transparent border and black (000000) grid lines
            c.setPlotArea(70, 75, 460, 240, -1, -1, Chart.Transparent, 0x000000, -1);

            // Set the x axis labels
            c.xAxis().setLabels(labels);

            // Show the same scale on the left and right y-axes
            c.syncYAxis();

            // Set y-axis tick density to 30 pixels. ChartDirector auto-scaling will use this as the
            // guideline when putting ticks on the y-axis.
            c.yAxis().setTickDensity(30);

            // Set all axes to transparent
            c.xAxis().setColors(Chart.Transparent);
            c.yAxis().setColors(Chart.Transparent);
            c.yAxis2().setColors(Chart.Transparent);

            // Set the x-axis margins to 15 pixels, so that the horizontal grid lines can extend
            // beyond the leftmost and rightmost vertical grid lines
            c.xAxis().setMargin(15, 15);

            // Set axis label style to 8pt Arial Bold
            c.xAxis().setLabelStyle("Arial Bold", 8);
            c.yAxis().setLabelStyle("Arial Bold", 8);
            c.yAxis2().setLabelStyle("Arial Bold", 8);

            // Add axis title using 10pt Arial Bold Italic font
            c.yAxis().setTitle("Revenue in USD millions", "Arial Bold Italic", 10);
            c.yAxis2().setTitle("Revenue in USD millions", "Arial Bold Italic", 10);

            // Add the first line. The missing data will be represented as gaps in the line (the
            // default behaviour)
            LineLayer layer0 = c.addLineLayer2();
            layer0.addDataSet(data0, 0xff0000, "Quantum Computer").setDataSymbol(
                Chart.GlassSphere2Shape, 11);
            layer0.setLineWidth(3);

            // Add the second line. The missing data will be represented by using dash lines to
            // bridge the gap
            LineLayer layer1 = c.addLineLayer2();
            layer1.addDataSet(data1, 0x00ff00, "Atom Synthesizer").setDataSymbol(
                Chart.GlassSphere2Shape, 11);
            layer1.setLineWidth(3);
            layer1.setGapColor(c.dashLineColor(0x00ff00));

            // Add the third line. The missing data will be ignored - just join the gap with the
            // original line style.
            LineLayer layer2 = c.addLineLayer2();
            layer2.addDataSet(data2, 0xff6600, "Proton Cannon").setDataSymbol(
                Chart.GlassSphere2Shape, 11);
            layer2.setLineWidth(3);
            layer2.setGapColor(Chart.SameAsMainColor);

            // layout the legend so we can get the height of the legend box
            c.layoutLegend();

            // Adjust the plot area size, such that the bounding box (inclusive of axes) is 15
            // pixels from the left edge, just under the legend box, 16 pixels from the right edge,
            // and 25 pixels from the bottom edge.
            c.packPlotArea(15, legendBox.getTopY() + legendBox.getHeight(), c.getWidth() - 16,
                c.getHeight() - 25);

            // Output the chart
            viewer.Chart = c;

            //include tool tip for the chart
            viewer.ImageMap = c.getHTMLImageMap("clickable", "",
                "title='Revenue of {dataSetName} in {xLabel}: US$ {value}M'");
        }
    }
}
[ASP.NET Web Forms - C# version] NetWebCharts\CSharpASP\missingpoints.aspx
(Click here on how to convert this code to code-behind style.)<%@ Page Language="C#" Debug="true" %>
<%@ Import Namespace="ChartDirector" %>
<%@ Register TagPrefix="chart" Namespace="ChartDirector" Assembly="netchartdir" %>
<!DOCTYPE html>
<script runat="server">
//
// Page Load event handler
//
protected void Page_Load(object sender, EventArgs e)
{
// The data for the chart
double[] data0 = {42, 49, Chart.NoValue, 38, 64, 56, 29, 41, 44, 57};
double[] data1 = {65, 75, 47, 34, 42, 49, 73, Chart.NoValue, 90, 69, 66, 78};
double[] data2 = {Chart.NoValue, Chart.NoValue, 25, 28, 38, 20, 22, Chart.NoValue, 25, 33, 30,
24};
string[] labels = {"Jan", "Feb", "Mar", "Apr", "May", "Jun", "Jul", "Aug", "Sep", "Oct", "Nov",
"Dec"};
// Create a XYChart object of size 600 x 360 pixels. Set background color to brushed silver,
// with a 2 pixel 3D border. Use rounded corners.
XYChart c = new XYChart(600, 360, Chart.brushedSilverColor(), Chart.Transparent, 2);
c.setRoundedFrame();
// Add a title using 18pt Times New Roman Bold Italic font. #Set top/bottom margins to 6 pixels.
ChartDirector.TextBox title = c.addTitle("Product Line Global Revenue",
"Times New Roman Bold Italic", 18);
title.setMargin2(0, 0, 6, 6);
// Add a separator line just under the title
c.addLine(10, title.getHeight(), c.getWidth() - 11, title.getHeight(), Chart.LineColor);
// Add a legend box where the top-center is anchored to the horizontal center of the chart, just
// under the title. Use horizontal layout and 10 points Arial Bold font, and transparent
// background and border.
LegendBox legendBox = c.addLegend(c.getWidth() / 2, title.getHeight(), false, "Arial Bold", 10);
legendBox.setAlignment(Chart.TopCenter);
legendBox.setBackground(Chart.Transparent, Chart.Transparent);
// Tentatively set the plotarea at (70, 75) and of 460 x 240 pixels in size. Use transparent
// border and black (000000) grid lines
c.setPlotArea(70, 75, 460, 240, -1, -1, Chart.Transparent, 0x000000, -1);
// Set the x axis labels
c.xAxis().setLabels(labels);
// Show the same scale on the left and right y-axes
c.syncYAxis();
// Set y-axis tick density to 30 pixels. ChartDirector auto-scaling will use this as the
// guideline when putting ticks on the y-axis.
c.yAxis().setTickDensity(30);
// Set all axes to transparent
c.xAxis().setColors(Chart.Transparent);
c.yAxis().setColors(Chart.Transparent);
c.yAxis2().setColors(Chart.Transparent);
// Set the x-axis margins to 15 pixels, so that the horizontal grid lines can extend beyond the
// leftmost and rightmost vertical grid lines
c.xAxis().setMargin(15, 15);
// Set axis label style to 8pt Arial Bold
c.xAxis().setLabelStyle("Arial Bold", 8);
c.yAxis().setLabelStyle("Arial Bold", 8);
c.yAxis2().setLabelStyle("Arial Bold", 8);
// Add axis title using 10pt Arial Bold Italic font
c.yAxis().setTitle("Revenue in USD millions", "Arial Bold Italic", 10);
c.yAxis2().setTitle("Revenue in USD millions", "Arial Bold Italic", 10);
// Add the first line. The missing data will be represented as gaps in the line (the default
// behaviour)
LineLayer layer0 = c.addLineLayer2();
layer0.addDataSet(data0, 0xff0000, "Quantum Computer").setDataSymbol(Chart.GlassSphere2Shape, 11
);
layer0.setLineWidth(3);
// Add the second line. The missing data will be represented by using dash lines to bridge the
// gap
LineLayer layer1 = c.addLineLayer2();
layer1.addDataSet(data1, 0x00ff00, "Atom Synthesizer").setDataSymbol(Chart.GlassSphere2Shape, 11
);
layer1.setLineWidth(3);
layer1.setGapColor(c.dashLineColor(0x00ff00));
// Add the third line. The missing data will be ignored - just join the gap with the original
// line style.
LineLayer layer2 = c.addLineLayer2();
layer2.addDataSet(data2, 0xff6600, "Proton Cannon").setDataSymbol(Chart.GlassSphere2Shape, 11);
layer2.setLineWidth(3);
layer2.setGapColor(Chart.SameAsMainColor);
// layout the legend so we can get the height of the legend box
c.layoutLegend();
// Adjust the plot area size, such that the bounding box (inclusive of axes) is 15 pixels from
// the left edge, just under the legend box, 16 pixels from the right edge, and 25 pixels from
// the bottom edge.
c.packPlotArea(15, legendBox.getTopY() + legendBox.getHeight(), c.getWidth() - 16, c.getHeight()
- 25);
// Output the chart
WebChartViewer1.Image = c.makeWebImage(Chart.SVG);
// Include tool tip for the chart
WebChartViewer1.ImageMap = c.getHTMLImageMap("", "",
"title='Revenue of {dataSetName} in {xLabel}: US$ {value}M'");
}
</script>
<html>
<head>
<script type="text/javascript" src="cdjcv.js"></script>
</head>
<body>
<chart:WebChartViewer id="WebChartViewer1" runat="server" />
</body>
</html>
[ASP.NET Web Forms - VB Version] NetWebCharts\VBNetASP\missingpoints.aspx
(Click here on how to convert this code to code-behind style.)<%@ Page Language="VB" Debug="true" %>
<%@ Import Namespace="ChartDirector" %>
<%@ Register TagPrefix="chart" Namespace="ChartDirector" Assembly="netchartdir" %>
<!DOCTYPE html>
<script runat="server">
'
' Page Load event handler
'
Protected Sub Page_Load(ByVal sender As System.Object, ByVal e As System.EventArgs)
' The data for the chart
Dim data0() As Double = {42, 49, Chart.NoValue, 38, 64, 56, 29, 41, 44, 57}
Dim data1() As Double = {65, 75, 47, 34, 42, 49, 73, Chart.NoValue, 90, 69, 66, 78}
Dim data2() As Double = {Chart.NoValue, Chart.NoValue, 25, 28, 38, 20, 22, Chart.NoValue, 25, _
33, 30, 24}
Dim labels() As String = {"Jan", "Feb", "Mar", "Apr", "May", "Jun", "Jul", "Aug", "Sep", _
"Oct", "Nov", "Dec"}
' Create a XYChart object of size 600 x 360 pixels. Set background color to brushed silver, with
' a 2 pixel 3D border. Use rounded corners.
Dim c As XYChart = New XYChart(600, 360, Chart.brushedSilverColor(), Chart.Transparent, 2)
c.setRoundedFrame()
' Add a title using 18pt Times New Roman Bold Italic font. #Set top/bottom margins to 6 pixels.
Dim title As ChartDirector.TextBox = c.addTitle("Product Line Global Revenue", _
"Times New Roman Bold Italic", 18)
title.setMargin2(0, 0, 6, 6)
' Add a separator line just under the title
c.addLine(10, title.getHeight(), c.getWidth() - 11, title.getHeight(), Chart.LineColor)
' Add a legend box where the top-center is anchored to the horizontal center of the chart, just
' under the title. Use horizontal layout and 10 points Arial Bold font, and transparent
' background and border.
Dim legendBox As LegendBox = c.addLegend(c.getWidth() / 2, title.getHeight(), False, _
"Arial Bold", 10)
legendBox.setAlignment(Chart.TopCenter)
legendBox.setBackground(Chart.Transparent, Chart.Transparent)
' Tentatively set the plotarea at (70, 75) and of 460 x 240 pixels in size. Use transparent
' border and black (000000) grid lines
c.setPlotArea(70, 75, 460, 240, -1, -1, Chart.Transparent, &H000000, -1)
' Set the x axis labels
c.xAxis().setLabels(labels)
' Show the same scale on the left and right y-axes
c.syncYAxis()
' Set y-axis tick density to 30 pixels. ChartDirector auto-scaling will use this as the
' guideline when putting ticks on the y-axis.
c.yAxis().setTickDensity(30)
' Set all axes to transparent
c.xAxis().setColors(Chart.Transparent)
c.yAxis().setColors(Chart.Transparent)
c.yAxis2().setColors(Chart.Transparent)
' Set the x-axis margins to 15 pixels, so that the horizontal grid lines can extend beyond the
' leftmost and rightmost vertical grid lines
c.xAxis().setMargin(15, 15)
' Set axis label style to 8pt Arial Bold
c.xAxis().setLabelStyle("Arial Bold", 8)
c.yAxis().setLabelStyle("Arial Bold", 8)
c.yAxis2().setLabelStyle("Arial Bold", 8)
' Add axis title using 10pt Arial Bold Italic font
c.yAxis().setTitle("Revenue in USD millions", "Arial Bold Italic", 10)
c.yAxis2().setTitle("Revenue in USD millions", "Arial Bold Italic", 10)
' Add the first line. The missing data will be represented as gaps in the line (the default
' behaviour)
Dim layer0 As LineLayer = c.addLineLayer2()
layer0.addDataSet(data0, &Hff0000, "Quantum Computer").setDataSymbol(Chart.GlassSphere2Shape, _
11)
layer0.setLineWidth(3)
' Add the second line. The missing data will be represented by using dash lines to bridge the
' gap
Dim layer1 As LineLayer = c.addLineLayer2()
layer1.addDataSet(data1, &H00ff00, "Atom Synthesizer").setDataSymbol(Chart.GlassSphere2Shape, _
11)
layer1.setLineWidth(3)
layer1.setGapColor(c.dashLineColor(&H00ff00))
' Add the third line. The missing data will be ignored - just join the gap with the original
' line style.
Dim layer2 As LineLayer = c.addLineLayer2()
layer2.addDataSet(data2, &Hff6600, "Proton Cannon").setDataSymbol(Chart.GlassSphere2Shape, 11)
layer2.setLineWidth(3)
layer2.setGapColor(Chart.SameAsMainColor)
' layout the legend so we can get the height of the legend box
c.layoutLegend()
' Adjust the plot area size, such that the bounding box (inclusive of axes) is 15 pixels from
' the left edge, just under the legend box, 16 pixels from the right edge, and 25 pixels from
' the bottom edge.
c.packPlotArea(15, legendBox.getTopY() + legendBox.getHeight(), c.getWidth() - 16, _
c.getHeight() - 25)
' Output the chart
WebChartViewer1.Image = c.makeWebImage(Chart.SVG)
' Include tool tip for the chart
WebChartViewer1.ImageMap = c.getHTMLImageMap("", "", _
"title='Revenue of {dataSetName} in {xLabel}: US$ {value}M'")
End Sub
</script>
<html>
<head>
<script type="text/javascript" src="cdjcv.js"></script>
</head>
<body>
<chart:WebChartViewer id="WebChartViewer1" runat="server" />
</body>
</html>
[ASP.NET MVC - Controller] NetMvcCharts\Controllers\MissingpointsController.cs
using System;
using System.Web.Mvc;
using ChartDirector;

namespace NetMvcCharts.Controllers
{
    public class MissingpointsController : Controller
    {
        //
        // Default Action
        //
        public ActionResult Index()
        {
            ViewBag.Title = "Missing Data Points";
            createChart(ViewBag.Viewer = new RazorChartViewer(HttpContext, "chart1"));
            return View("~/Views/Shared/ChartView.cshtml");
        }

        //
        // Create chart
        //
        private void createChart(RazorChartViewer viewer)
        {
            // The data for the chart
            double[] data0 = {42, 49, Chart.NoValue, 38, 64, 56, 29, 41, 44, 57};
            double[] data1 = {65, 75, 47, 34, 42, 49, 73, Chart.NoValue, 90, 69, 66, 78};
            double[] data2 = {Chart.NoValue, Chart.NoValue, 25, 28, 38, 20, 22, Chart.NoValue, 25, 33,
                30, 24};
            string[] labels = {"Jan", "Feb", "Mar", "Apr", "May", "Jun", "Jul", "Aug", "Sep", "Oct",
                "Nov", "Dec"};

            // Create a XYChart object of size 600 x 360 pixels. Set background color to brushed silver,
            // with a 2 pixel 3D border. Use rounded corners.
            XYChart c = new XYChart(600, 360, Chart.brushedSilverColor(), Chart.Transparent, 2);
            c.setRoundedFrame();

            // Add a title using 18pt Times New Roman Bold Italic font. #Set top/bottom margins to 6
            // pixels.
            ChartDirector.TextBox title = c.addTitle("Product Line Global Revenue",
                "Times New Roman Bold Italic", 18);
            title.setMargin2(0, 0, 6, 6);

            // Add a separator line just under the title
            c.addLine(10, title.getHeight(), c.getWidth() - 11, title.getHeight(), Chart.LineColor);

            // Add a legend box where the top-center is anchored to the horizontal center of the chart,
            // just under the title. Use horizontal layout and 10 points Arial Bold font, and transparent
            // background and border.
            LegendBox legendBox = c.addLegend(c.getWidth() / 2, title.getHeight(), false, "Arial Bold",
                10);
            legendBox.setAlignment(Chart.TopCenter);
            legendBox.setBackground(Chart.Transparent, Chart.Transparent);

            // Tentatively set the plotarea at (70, 75) and of 460 x 240 pixels in size. Use transparent
            // border and black (000000) grid lines
            c.setPlotArea(70, 75, 460, 240, -1, -1, Chart.Transparent, 0x000000, -1);

            // Set the x axis labels
            c.xAxis().setLabels(labels);

            // Show the same scale on the left and right y-axes
            c.syncYAxis();

            // Set y-axis tick density to 30 pixels. ChartDirector auto-scaling will use this as the
            // guideline when putting ticks on the y-axis.
            c.yAxis().setTickDensity(30);

            // Set all axes to transparent
            c.xAxis().setColors(Chart.Transparent);
            c.yAxis().setColors(Chart.Transparent);
            c.yAxis2().setColors(Chart.Transparent);

            // Set the x-axis margins to 15 pixels, so that the horizontal grid lines can extend beyond
            // the leftmost and rightmost vertical grid lines
            c.xAxis().setMargin(15, 15);

            // Set axis label style to 8pt Arial Bold
            c.xAxis().setLabelStyle("Arial Bold", 8);
            c.yAxis().setLabelStyle("Arial Bold", 8);
            c.yAxis2().setLabelStyle("Arial Bold", 8);

            // Add axis title using 10pt Arial Bold Italic font
            c.yAxis().setTitle("Revenue in USD millions", "Arial Bold Italic", 10);
            c.yAxis2().setTitle("Revenue in USD millions", "Arial Bold Italic", 10);

            // Add the first line. The missing data will be represented as gaps in the line (the default
            // behaviour)
            LineLayer layer0 = c.addLineLayer2();
            layer0.addDataSet(data0, 0xff0000, "Quantum Computer").setDataSymbol(Chart.GlassSphere2Shape,
                11);
            layer0.setLineWidth(3);

            // Add the second line. The missing data will be represented by using dash lines to bridge
            // the gap
            LineLayer layer1 = c.addLineLayer2();
            layer1.addDataSet(data1, 0x00ff00, "Atom Synthesizer").setDataSymbol(Chart.GlassSphere2Shape,
                11);
            layer1.setLineWidth(3);
            layer1.setGapColor(c.dashLineColor(0x00ff00));

            // Add the third line. The missing data will be ignored - just join the gap with the original
            // line style.
            LineLayer layer2 = c.addLineLayer2();
            layer2.addDataSet(data2, 0xff6600, "Proton Cannon").setDataSymbol(Chart.GlassSphere2Shape, 11
                );
            layer2.setLineWidth(3);
            layer2.setGapColor(Chart.SameAsMainColor);

            // layout the legend so we can get the height of the legend box
            c.layoutLegend();

            // Adjust the plot area size, such that the bounding box (inclusive of axes) is 15 pixels
            // from the left edge, just under the legend box, 16 pixels from the right edge, and 25
            // pixels from the bottom edge.
            c.packPlotArea(15, legendBox.getTopY() + legendBox.getHeight(), c.getWidth() - 16,
                c.getHeight() - 25);

            // Output the chart
            viewer.Image = c.makeWebImage(Chart.SVG);

            // Include tool tip for the chart
            viewer.ImageMap = c.getHTMLImageMap("", "",
                "title='Revenue of {dataSetName} in {xLabel}: US$ {value}M'");
        }
    }
}
[ASP.NET MVC - View] NetMvcCharts\Views\Shared\ChartView.cshtml
@{ Layout = null; }

<!DOCTYPE html>

<html>
<head>
    <meta name="viewport" content="width=device-width" />
    <title>@ViewBag.Title</title>
    <style>
        @ViewBag.Style
    </style>
    @Scripts.Render("~/Scripts/cdjcv.js")
</head>
<body style="margin:5px 0px 0px 5px">
    <div style="font:bold 18pt verdana;">
        @ViewBag.Title
    </div>
    <hr style="border:solid 1px #000080; background:#000080" />
    <div>
        @{
            if (ViewBag.Viewer is Array)
            {
                // Display multiple charts
                for (int i = 0; i < ViewBag.Viewer.Length; ++i)
                {
                    @:@Html.Raw(ViewBag.Viewer[i].RenderHTML())
                }
            }
            else
            {
                // Display one chart only
                @:@Html.Raw(ViewBag.Viewer.RenderHTML())
            }
        }
    </div>
</body>
</html>
© 2023 Advanced Software Engineering Limited. All rights reserved.