[Windows Forms - C# version] NetWinCharts\CSharpWinCharts\multileveltreemap.cs
using System;
using ChartDirector;
namespace CSharpChartExplorer
{
public class multileveltreemap : DemoModule
{
//Name of demo module
public string getName() { return "Multi Level Tree Map"; }
//Number of charts produced in this demo module
public int getNoOfCharts() { return 1; }
//Main code for creating chart.
//Note: the argument chartIndex is unused because this demo only has 1 chart.
public void createChart(WinChartViewer viewer, int chartIndex)
{
// The first level nodes of the tree map. There are 5 nodes.
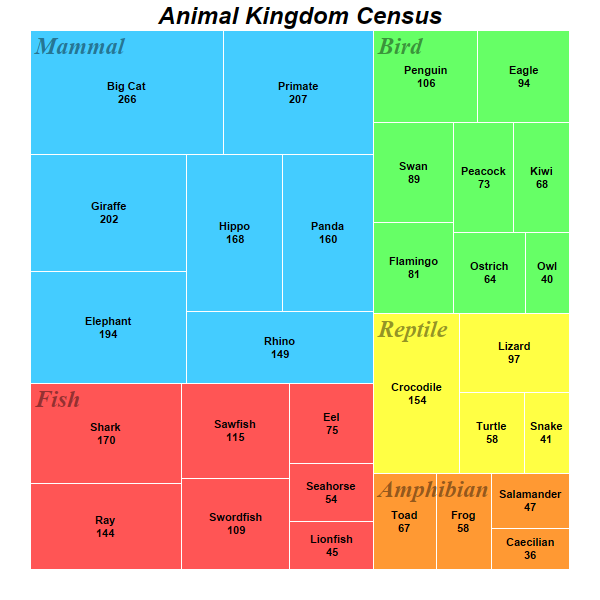
string[] animals = {"Fish", "Amphibian", "Reptile", "Bird", "Mammal"};
// In this example, the colors are based on the first level nodes.
int[] colors = {0xff5555, 0xff9933, 0xffff44, 0x66ff66, 0x44ccff};
// Data for the second level nodes in "Fish"
string[] fish_names = {"Shark", "Ray", "Swordfish", "Sawfish", "Eel", "Lionfish",
"Seahorse"};
double[] fish_data = {170, 144, 109, 115, 75, 45, 54};
// Data for the second level nodes in "Bird"
string[] bird_names = {"Swan", "Ostrich", "Eagle", "Penguin", "Kiwi", "Flamingo", "Owl",
"Peacock"};
double[] bird_data = {89, 64, 94, 106, 68, 81, 40, 73};
// Data for the second level nodes in "Amphibian"
string[] amphibian_names = {"Toad", "Salamander", "Frog", "Caecilian"};
double[] amphibian_data = {67, 47, 58, 36};
// Data for the second level nodes in "Reptile"
string[] reptile_names = {"Turtle", "Crocodile", "Lizard", "Snake"};
double[] reptile_data = {58, 154, 97, 41};
// Data for the second level nodes in "Mammal"
string[] mammal_names = {"Big Cat", "Primate", "Panda", "Elephant", "Hippo", "Rhino",
"Giraffe"};
double[] mammal_data = {266, 207, 160, 194, 168, 149, 202};
// Create a Tree Map object of size 600 x 600 pixels
TreeMapChart c = new TreeMapChart(600, 600);
// Add a title to the chart
c.addTitle("Animal Kingdom Census", "Arial Bold Italic", 18);
// Set the plotarea at (30, 30) and of size 540 x 540 pixels
c.setPlotArea(30, 30, 540, 540);
// Obtain the root of the tree map, which is the entire plot area
TreeMapNode root = c.getRootNode();
// Add first level nodes to the root. We do not need to provide data as they will be
// computed as the sum of the second level nodes.
root.setData(null, animals, colors);
// Add second level nodes to each of the first level node
root.getNode(0).setData(fish_data, fish_names);
root.getNode(1).setData(amphibian_data, amphibian_names);
root.getNode(2).setData(reptile_data, reptile_names);
root.getNode(3).setData(bird_data, bird_names);
root.getNode(4).setData(mammal_data, mammal_names);
// Get the prototype (template) for the first level nodes.
TreeMapNode nodeConfig = c.getLevelPrototype(1);
// Set the label format for the nodes to show the label with 8pt Arial Bold font in
// semi-transparent black color (0x77000000). Put the text at the top left corner of the
// cell.
nodeConfig.setLabelFormat("{label}", "Times New Roman Bold Italic", 18, 0x77000000,
Chart.TopLeft);
// Set the border color to white (ffffff)
nodeConfig.setColors(-1, 0xffffff);
// Get the prototype (template) for the second level nodes.
TreeMapNode nodeConfig2 = c.getLevelPrototype(2);
// Set the label format for the nodes to show the label and value with 8pt Arial Bold
// font. Put the text at the center of the cell.
nodeConfig2.setLabelFormat("{label}<*br*>{value}", "Arial Bold", 8, Chart.TextColor,
Chart.Center);
// Set the border color to white (ffffff)
nodeConfig2.setColors(-1, 0xffffff);
// Output the chart
viewer.Chart = c;
//include tool tip for the chart
viewer.ImageMap = c.getHTMLImageMap("clickable", "", "title='<*cdml*>{label}: {value}'")
;
}
}
}
[Windows Forms - VB Version] NetWinCharts\VBNetWinCharts\multileveltreemap.vb
Imports System
Imports Microsoft.VisualBasic
Imports ChartDirector

Public Class multileveltreemap
    Implements DemoModule

    'Name of demo module
    Public Function getName() As String Implements DemoModule.getName
        Return "Multi Level Tree Map"
    End Function

    'Number of charts produced in this demo module
    Public Function getNoOfCharts() As Integer Implements DemoModule.getNoOfCharts
        Return 1
    End Function

    'Main code for creating chart.
    'Note: the argument chartIndex is unused because this demo only has 1 chart.
    Public Sub createChart(viewer As WinChartViewer, chartIndex As Integer) _
        Implements DemoModule.createChart

        ' The first level nodes of the tree map. There are 5 nodes.
        Dim animals() As String = {"Fish", "Amphibian", "Reptile", "Bird", "Mammal"}

        ' In this example, the colors are based on the first level nodes.
        Dim colors() As Integer = {&Hff5555, &Hff9933, &Hffff44, &H66ff66, &H44ccff}

        ' Data for the second level nodes in "Fish"
        Dim fish_names() As String = {"Shark", "Ray", "Swordfish", "Sawfish", "Eel", "Lionfish", _
            "Seahorse"}
        Dim fish_data() As Double = {170, 144, 109, 115, 75, 45, 54}

        ' Data for the second level nodes in "Bird"
        Dim bird_names() As String = {"Swan", "Ostrich", "Eagle", "Penguin", "Kiwi", "Flamingo", _
            "Owl", "Peacock"}
        Dim bird_data() As Double = {89, 64, 94, 106, 68, 81, 40, 73}

        ' Data for the second level nodes in "Amphibian"
        Dim amphibian_names() As String = {"Toad", "Salamander", "Frog", "Caecilian"}
        Dim amphibian_data() As Double = {67, 47, 58, 36}

        ' Data for the second level nodes in "Reptile"
        Dim reptile_names() As String = {"Turtle", "Crocodile", "Lizard", "Snake"}
        Dim reptile_data() As Double = {58, 154, 97, 41}

        ' Data for the second level nodes in "Mammal"
        Dim mammal_names() As String = {"Big Cat", "Primate", "Panda", "Elephant", "Hippo", _
            "Rhino", "Giraffe"}
        Dim mammal_data() As Double = {266, 207, 160, 194, 168, 149, 202}

        ' Create a Tree Map object of size 600 x 600 pixels
        Dim c As TreeMapChart = New TreeMapChart(600, 600)

        ' Add a title to the chart
        c.addTitle("Animal Kingdom Census", "Arial Bold Italic", 18)

        ' Set the plotarea at (30, 30) and of size 540 x 540 pixels
        c.setPlotArea(30, 30, 540, 540)

        ' Obtain the root of the tree map, which is the entire plot area
        Dim root As TreeMapNode = c.getRootNode()

        ' Add first level nodes to the root. We do not need to provide data as they will be computed
        ' as the sum of the second level nodes.
        root.setData(Nothing, animals, colors)

        ' Add second level nodes to each of the first level node
        root.getNode(0).setData(fish_data, fish_names)
        root.getNode(1).setData(amphibian_data, amphibian_names)
        root.getNode(2).setData(reptile_data, reptile_names)
        root.getNode(3).setData(bird_data, bird_names)
        root.getNode(4).setData(mammal_data, mammal_names)

        ' Get the prototype (template) for the first level nodes.
        Dim nodeConfig As TreeMapNode = c.getLevelPrototype(1)

        ' Set the label format for the nodes to show the label with 8pt Arial Bold font in
        ' semi-transparent black color (0x77000000). Put the text at the top left corner of the
        ' cell.
        nodeConfig.setLabelFormat("{label}", "Times New Roman Bold Italic", 18, &H77000000, _
            Chart.TopLeft)

        ' Set the border color to white (ffffff)
        nodeConfig.setColors(-1, &Hffffff)

        ' Get the prototype (template) for the second level nodes.
        Dim nodeConfig2 As TreeMapNode = c.getLevelPrototype(2)

        ' Set the label format for the nodes to show the label and value with 8pt Arial Bold font.
        ' Put the text at the center of the cell.
        nodeConfig2.setLabelFormat("{label}<*br*>{value}", "Arial Bold", 8, Chart.TextColor, _
            Chart.Center)

        ' Set the border color to white (ffffff)
        nodeConfig2.setColors(-1, &Hffffff)

        ' Output the chart
        viewer.Chart = c

        'include tool tip for the chart
        viewer.ImageMap = c.getHTMLImageMap("clickable", "", "title='<*cdml*>{label}: {value}'")

    End Sub

End Class
[WPF - C#] NetWPFCharts\CSharpWPFCharts\multileveltreemap.cs
using System;
using ChartDirector;

namespace CSharpWPFCharts
{
    public class multileveltreemap : DemoModule
    {
        //Name of demo module
        public string getName() { return "Multi Level Tree Map"; }

        //Number of charts produced in this demo module
        public int getNoOfCharts() { return 1; }

        //Main code for creating chart.
        //Note: the argument chartIndex is unused because this demo only has 1 chart.
        public void createChart(WPFChartViewer viewer, int chartIndex)
        {
            // The first level nodes of the tree map. There are 5 nodes.
            string[] animals = {"Fish", "Amphibian", "Reptile", "Bird", "Mammal"};

            // In this example, the colors are based on the first level nodes.
            int[] colors = {0xff5555, 0xff9933, 0xffff44, 0x66ff66, 0x44ccff};

            // Data for the second level nodes in "Fish"
            string[] fish_names = {"Shark", "Ray", "Swordfish", "Sawfish", "Eel", "Lionfish",
                "Seahorse"};
            double[] fish_data = {170, 144, 109, 115, 75, 45, 54};

            // Data for the second level nodes in "Bird"
            string[] bird_names = {"Swan", "Ostrich", "Eagle", "Penguin", "Kiwi", "Flamingo", "Owl",
                "Peacock"};
            double[] bird_data = {89, 64, 94, 106, 68, 81, 40, 73};

            // Data for the second level nodes in "Amphibian"
            string[] amphibian_names = {"Toad", "Salamander", "Frog", "Caecilian"};
            double[] amphibian_data = {67, 47, 58, 36};

            // Data for the second level nodes in "Reptile"
            string[] reptile_names = {"Turtle", "Crocodile", "Lizard", "Snake"};
            double[] reptile_data = {58, 154, 97, 41};

            // Data for the second level nodes in "Mammal"
            string[] mammal_names = {"Big Cat", "Primate", "Panda", "Elephant", "Hippo", "Rhino",
                "Giraffe"};
            double[] mammal_data = {266, 207, 160, 194, 168, 149, 202};

            // Create a Tree Map object of size 600 x 600 pixels
            TreeMapChart c = new TreeMapChart(600, 600);

            // Add a title to the chart
            c.addTitle("Animal Kingdom Census", "Arial Bold Italic", 18);

            // Set the plotarea at (30, 30) and of size 540 x 540 pixels
            c.setPlotArea(30, 30, 540, 540);

            // Obtain the root of the tree map, which is the entire plot area
            TreeMapNode root = c.getRootNode();

            // Add first level nodes to the root. We do not need to provide data as they will be
            // computed as the sum of the second level nodes.
            root.setData(null, animals, colors);

            // Add second level nodes to each of the first level node
            root.getNode(0).setData(fish_data, fish_names);
            root.getNode(1).setData(amphibian_data, amphibian_names);
            root.getNode(2).setData(reptile_data, reptile_names);
            root.getNode(3).setData(bird_data, bird_names);
            root.getNode(4).setData(mammal_data, mammal_names);

            // Get the prototype (template) for the first level nodes.
            TreeMapNode nodeConfig = c.getLevelPrototype(1);

            // Set the label format for the nodes to show the label with 8pt Arial Bold font in
            // semi-transparent black color (0x77000000). Put the text at the top left corner of the
            // cell.
            nodeConfig.setLabelFormat("{label}", "Times New Roman Bold Italic", 18, 0x77000000,
                Chart.TopLeft);

            // Set the border color to white (ffffff)
            nodeConfig.setColors(-1, 0xffffff);

            // Get the prototype (template) for the second level nodes.
            TreeMapNode nodeConfig2 = c.getLevelPrototype(2);

            // Set the label format for the nodes to show the label and value with 8pt Arial Bold
            // font. Put the text at the center of the cell.
            nodeConfig2.setLabelFormat("{label}<*br*>{value}", "Arial Bold", 8, Chart.TextColor,
                Chart.Center);

            // Set the border color to white (ffffff)
            nodeConfig2.setColors(-1, 0xffffff);

            // Output the chart
            viewer.Chart = c;

            //include tool tip for the chart
            viewer.ImageMap = c.getHTMLImageMap("clickable", "", "title='<*cdml*>{label}: {value}'")
                ;
        }
    }
}
[ASP.NET Web Forms - C# version] NetWebCharts\CSharpASP\multileveltreemap.aspx
(Click here on how to convert this code to code-behind style.)<%@ Page Language="C#" Debug="true" %>
<%@ Import Namespace="ChartDirector" %>
<%@ Register TagPrefix="chart" Namespace="ChartDirector" Assembly="netchartdir" %>
<!DOCTYPE html>
<script runat="server">
//
// Page Load event handler
//
protected void Page_Load(object sender, EventArgs e)
{
// The first level nodes of the tree map. There are 5 nodes.
string[] animals = {"Fish", "Amphibian", "Reptile", "Bird", "Mammal"};
// In this example, the colors are based on the first level nodes.
int[] colors = {0xff5555, 0xff9933, 0xffff44, 0x66ff66, 0x44ccff};
// Data for the second level nodes in "Fish"
string[] fish_names = {"Shark", "Ray", "Swordfish", "Sawfish", "Eel", "Lionfish", "Seahorse"};
double[] fish_data = {170, 144, 109, 115, 75, 45, 54};
// Data for the second level nodes in "Bird"
string[] bird_names = {"Swan", "Ostrich", "Eagle", "Penguin", "Kiwi", "Flamingo", "Owl",
"Peacock"};
double[] bird_data = {89, 64, 94, 106, 68, 81, 40, 73};
// Data for the second level nodes in "Amphibian"
string[] amphibian_names = {"Toad", "Salamander", "Frog", "Caecilian"};
double[] amphibian_data = {67, 47, 58, 36};
// Data for the second level nodes in "Reptile"
string[] reptile_names = {"Turtle", "Crocodile", "Lizard", "Snake"};
double[] reptile_data = {58, 154, 97, 41};
// Data for the second level nodes in "Mammal"
string[] mammal_names = {"Big Cat", "Primate", "Panda", "Elephant", "Hippo", "Rhino", "Giraffe"}
;
double[] mammal_data = {266, 207, 160, 194, 168, 149, 202};
// Create a Tree Map object of size 600 x 600 pixels
TreeMapChart c = new TreeMapChart(600, 600);
// Add a title to the chart
c.addTitle("Animal Kingdom Census", "Arial Bold Italic", 18);
// Set the plotarea at (30, 30) and of size 540 x 540 pixels
c.setPlotArea(30, 30, 540, 540);
// Obtain the root of the tree map, which is the entire plot area
TreeMapNode root = c.getRootNode();
// Add first level nodes to the root. We do not need to provide data as they will be computed as
// the sum of the second level nodes.
root.setData(null, animals, colors);
// Add second level nodes to each of the first level node
root.getNode(0).setData(fish_data, fish_names);
root.getNode(1).setData(amphibian_data, amphibian_names);
root.getNode(2).setData(reptile_data, reptile_names);
root.getNode(3).setData(bird_data, bird_names);
root.getNode(4).setData(mammal_data, mammal_names);
// Get the prototype (template) for the first level nodes.
TreeMapNode nodeConfig = c.getLevelPrototype(1);
// Set the label format for the nodes to show the label with 8pt Arial Bold font in
// semi-transparent black color (0x77000000). Put the text at the top left corner of the cell.
nodeConfig.setLabelFormat("{label}", "Times New Roman Bold Italic", 18, 0x77000000,
Chart.TopLeft);
// Set the border color to white (ffffff)
nodeConfig.setColors(-1, 0xffffff);
// Get the prototype (template) for the second level nodes.
TreeMapNode nodeConfig2 = c.getLevelPrototype(2);
// Set the label format for the nodes to show the label and value with 8pt Arial Bold font. Put
// the text at the center of the cell.
nodeConfig2.setLabelFormat("{label}<*br*>{value}", "Arial Bold", 8, Chart.TextColor,
Chart.Center);
// Set the border color to white (ffffff)
nodeConfig2.setColors(-1, 0xffffff);
// Output the chart
WebChartViewer1.Image = c.makeWebImage(Chart.SVG);
// Include tool tip for the chart
WebChartViewer1.ImageMap = c.getHTMLImageMap("", "", "title='<*cdml*>{label}: {value}'");
}
</script>
<html>
<head>
<script type="text/javascript" src="cdjcv.js"></script>
</head>
<body>
<chart:WebChartViewer id="WebChartViewer1" runat="server" />
</body>
</html>
[ASP.NET Web Forms - VB Version] NetWebCharts\VBNetASP\multileveltreemap.aspx
(Click here on how to convert this code to code-behind style.)<%@ Page Language="VB" Debug="true" %>
<%@ Import Namespace="ChartDirector" %>
<%@ Register TagPrefix="chart" Namespace="ChartDirector" Assembly="netchartdir" %>
<!DOCTYPE html>
<script runat="server">
'
' Page Load event handler
'
Protected Sub Page_Load(ByVal sender As System.Object, ByVal e As System.EventArgs)
' The first level nodes of the tree map. There are 5 nodes.
Dim animals() As String = {"Fish", "Amphibian", "Reptile", "Bird", "Mammal"}
' In this example, the colors are based on the first level nodes.
Dim colors() As Integer = {&Hff5555, &Hff9933, &Hffff44, &H66ff66, &H44ccff}
' Data for the second level nodes in "Fish"
Dim fish_names() As String = {"Shark", "Ray", "Swordfish", "Sawfish", "Eel", "Lionfish", _
"Seahorse"}
Dim fish_data() As Double = {170, 144, 109, 115, 75, 45, 54}
' Data for the second level nodes in "Bird"
Dim bird_names() As String = {"Swan", "Ostrich", "Eagle", "Penguin", "Kiwi", "Flamingo", _
"Owl", "Peacock"}
Dim bird_data() As Double = {89, 64, 94, 106, 68, 81, 40, 73}
' Data for the second level nodes in "Amphibian"
Dim amphibian_names() As String = {"Toad", "Salamander", "Frog", "Caecilian"}
Dim amphibian_data() As Double = {67, 47, 58, 36}
' Data for the second level nodes in "Reptile"
Dim reptile_names() As String = {"Turtle", "Crocodile", "Lizard", "Snake"}
Dim reptile_data() As Double = {58, 154, 97, 41}
' Data for the second level nodes in "Mammal"
Dim mammal_names() As String = {"Big Cat", "Primate", "Panda", "Elephant", "Hippo", "Rhino", _
"Giraffe"}
Dim mammal_data() As Double = {266, 207, 160, 194, 168, 149, 202}
' Create a Tree Map object of size 600 x 600 pixels
Dim c As TreeMapChart = New TreeMapChart(600, 600)
' Add a title to the chart
c.addTitle("Animal Kingdom Census", "Arial Bold Italic", 18)
' Set the plotarea at (30, 30) and of size 540 x 540 pixels
c.setPlotArea(30, 30, 540, 540)
' Obtain the root of the tree map, which is the entire plot area
Dim root As TreeMapNode = c.getRootNode()
' Add first level nodes to the root. We do not need to provide data as they will be computed as
' the sum of the second level nodes.
root.setData(Nothing, animals, colors)
' Add second level nodes to each of the first level node
root.getNode(0).setData(fish_data, fish_names)
root.getNode(1).setData(amphibian_data, amphibian_names)
root.getNode(2).setData(reptile_data, reptile_names)
root.getNode(3).setData(bird_data, bird_names)
root.getNode(4).setData(mammal_data, mammal_names)
' Get the prototype (template) for the first level nodes.
Dim nodeConfig As TreeMapNode = c.getLevelPrototype(1)
' Set the label format for the nodes to show the label with 8pt Arial Bold font in
' semi-transparent black color (0x77000000). Put the text at the top left corner of the cell.
nodeConfig.setLabelFormat("{label}", "Times New Roman Bold Italic", 18, &H77000000, _
Chart.TopLeft)
' Set the border color to white (ffffff)
nodeConfig.setColors(-1, &Hffffff)
' Get the prototype (template) for the second level nodes.
Dim nodeConfig2 As TreeMapNode = c.getLevelPrototype(2)
' Set the label format for the nodes to show the label and value with 8pt Arial Bold font. Put
' the text at the center of the cell.
nodeConfig2.setLabelFormat("{label}<*br*>{value}", "Arial Bold", 8, Chart.TextColor, _
Chart.Center)
' Set the border color to white (ffffff)
nodeConfig2.setColors(-1, &Hffffff)
' Output the chart
WebChartViewer1.Image = c.makeWebImage(Chart.SVG)
' Include tool tip for the chart
WebChartViewer1.ImageMap = c.getHTMLImageMap("", "", "title='<*cdml*>{label}: {value}'")
End Sub
</script>
<html>
<head>
<script type="text/javascript" src="cdjcv.js"></script>
</head>
<body>
<chart:WebChartViewer id="WebChartViewer1" runat="server" />
</body>
</html>
[ASP.NET MVC - Controller] NetMvcCharts\Controllers\MultileveltreemapController.cs
using System;
using System.Web.Mvc;
using ChartDirector;

namespace NetMvcCharts.Controllers
{
    public class MultileveltreemapController : Controller
    {
        //
        // Default Action
        //
        public ActionResult Index()
        {
            ViewBag.Title = "Multi Level Tree Map";
            createChart(ViewBag.Viewer = new RazorChartViewer(HttpContext, "chart1"));
            return View("~/Views/Shared/ChartView.cshtml");
        }

        //
        // Create chart
        //
        private void createChart(RazorChartViewer viewer)
        {
            // The first level nodes of the tree map. There are 5 nodes.
            string[] animals = {"Fish", "Amphibian", "Reptile", "Bird", "Mammal"};

            // In this example, the colors are based on the first level nodes.
            int[] colors = {0xff5555, 0xff9933, 0xffff44, 0x66ff66, 0x44ccff};

            // Data for the second level nodes in "Fish"
            string[] fish_names = {"Shark", "Ray", "Swordfish", "Sawfish", "Eel", "Lionfish", "Seahorse"}
                ;
            double[] fish_data = {170, 144, 109, 115, 75, 45, 54};

            // Data for the second level nodes in "Bird"
            string[] bird_names = {"Swan", "Ostrich", "Eagle", "Penguin", "Kiwi", "Flamingo", "Owl",
                "Peacock"};
            double[] bird_data = {89, 64, 94, 106, 68, 81, 40, 73};

            // Data for the second level nodes in "Amphibian"
            string[] amphibian_names = {"Toad", "Salamander", "Frog", "Caecilian"};
            double[] amphibian_data = {67, 47, 58, 36};

            // Data for the second level nodes in "Reptile"
            string[] reptile_names = {"Turtle", "Crocodile", "Lizard", "Snake"};
            double[] reptile_data = {58, 154, 97, 41};

            // Data for the second level nodes in "Mammal"
            string[] mammal_names = {"Big Cat", "Primate", "Panda", "Elephant", "Hippo", "Rhino",
                "Giraffe"};
            double[] mammal_data = {266, 207, 160, 194, 168, 149, 202};

            // Create a Tree Map object of size 600 x 600 pixels
            TreeMapChart c = new TreeMapChart(600, 600);

            // Add a title to the chart
            c.addTitle("Animal Kingdom Census", "Arial Bold Italic", 18);

            // Set the plotarea at (30, 30) and of size 540 x 540 pixels
            c.setPlotArea(30, 30, 540, 540);

            // Obtain the root of the tree map, which is the entire plot area
            TreeMapNode root = c.getRootNode();

            // Add first level nodes to the root. We do not need to provide data as they will be computed
            // as the sum of the second level nodes.
            root.setData(null, animals, colors);

            // Add second level nodes to each of the first level node
            root.getNode(0).setData(fish_data, fish_names);
            root.getNode(1).setData(amphibian_data, amphibian_names);
            root.getNode(2).setData(reptile_data, reptile_names);
            root.getNode(3).setData(bird_data, bird_names);
            root.getNode(4).setData(mammal_data, mammal_names);

            // Get the prototype (template) for the first level nodes.
            TreeMapNode nodeConfig = c.getLevelPrototype(1);

            // Set the label format for the nodes to show the label with 8pt Arial Bold font in
            // semi-transparent black color (0x77000000). Put the text at the top left corner of the
            // cell.
            nodeConfig.setLabelFormat("{label}", "Times New Roman Bold Italic", 18, 0x77000000,
                Chart.TopLeft);

            // Set the border color to white (ffffff)
            nodeConfig.setColors(-1, 0xffffff);

            // Get the prototype (template) for the second level nodes.
            TreeMapNode nodeConfig2 = c.getLevelPrototype(2);

            // Set the label format for the nodes to show the label and value with 8pt Arial Bold font.
            // Put the text at the center of the cell.
            nodeConfig2.setLabelFormat("{label}<*br*>{value}", "Arial Bold", 8, Chart.TextColor,
                Chart.Center);

            // Set the border color to white (ffffff)
            nodeConfig2.setColors(-1, 0xffffff);

            // Output the chart
            viewer.Image = c.makeWebImage(Chart.SVG);

            // Include tool tip for the chart
            viewer.ImageMap = c.getHTMLImageMap("", "", "title='<*cdml*>{label}: {value}'");
        }
    }
}
[ASP.NET MVC - View] NetMvcCharts\Views\Shared\ChartView.cshtml
@{ Layout = null; }

<!DOCTYPE html>

<html>
<head>
    <meta name="viewport" content="width=device-width" />
    <title>@ViewBag.Title</title>
    <style>
        @ViewBag.Style
    </style>
    @Scripts.Render("~/Scripts/cdjcv.js")
</head>
<body style="margin:5px 0px 0px 5px">
    <div style="font:bold 18pt verdana;">
        @ViewBag.Title
    </div>
    <hr style="border:solid 1px #000080; background:#000080" />
    <div>
        @{
            if (ViewBag.Viewer is Array)
            {
                // Display multiple charts
                for (int i = 0; i < ViewBag.Viewer.Length; ++i)
                {
                    @:@Html.Raw(ViewBag.Viewer[i].RenderHTML())
                }
            }
            else
            {
                // Display one chart only
                @:@Html.Raw(ViewBag.Viewer.RenderHTML())
            }
        }
    </div>
</body>
</html>
© 2023 Advanced Software Engineering Limited. All rights reserved.