[Windows Forms - C# version] NetWinCharts\CSharpWinCharts\multistackbar.cs
using System;
using ChartDirector;
namespace CSharpChartExplorer
{
public class multistackbar : DemoModule
{
//Name of demo module
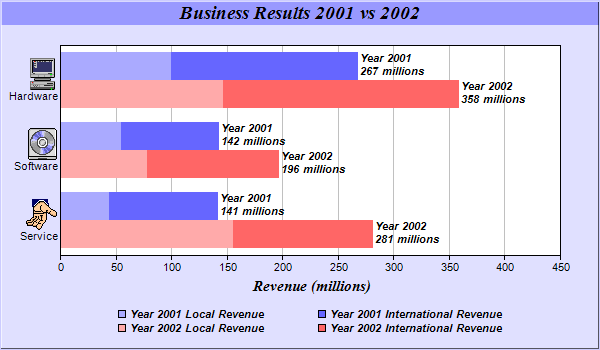
public string getName() { return "Multi-Stacked Bar Chart"; }
//Number of charts produced in this demo module
public int getNoOfCharts() { return 1; }
//Main code for creating chart.
//Note: the argument chartIndex is unused because this demo only has 1 chart.
public void createChart(WinChartViewer viewer, int chartIndex)
{
// The data for the bar chart
double[] data0 = {44, 55, 100};
double[] data1 = {97, 87, 167};
double[] data2 = {156, 78, 147};
double[] data3 = {125, 118, 211};
// The labels for the bar chart. The labels contains embedded images as icons.
string[] labels = {"<*img=@/images/service.png*><*br*>Service",
"<*img=@/images/software.png*><*br*>Software",
"<*img=@/images/computer.png*><*br*>Hardware"};
// Create a XYChart object of size 600 x 350 pixels, using 0xe0e0ff as the background
// color, 0xccccff as the border color, with 1 pixel 3D border effect.
XYChart c = new XYChart(600, 350, 0xe0e0ff, 0xccccff, 1);
// Add a title to the chart using 14 points Times Bold Itatic font and light blue
// (0x9999ff) as the background color
c.addTitle("Business Results 2001 vs 2002", "Times New Roman Bold Italic", 14
).setBackground(0x9999ff);
// Set the plotarea at (60, 45) and of size 500 x 210 pixels, using white (0xffffff) as
// the background
c.setPlotArea(60, 45, 500, 210, 0xffffff);
// Swap the x and y axes to create a horizontal bar chart
c.swapXY();
// Add a title to the y axis using 11 pt Times Bold Italic as font
c.yAxis().setTitle("Revenue (millions)", "Times New Roman Bold Italic", 11);
// Set the labels on the x axis
c.xAxis().setLabels(labels);
// Disable x-axis ticks by setting the tick length to 0
c.xAxis().setTickLength(0);
// Add a stacked bar layer to the chart
BarLayer layer = c.addBarLayer2(Chart.Stack);
// Add the first two data sets to the chart as a stacked bar group
layer.addDataGroup("2001");
layer.addDataSet(data0, 0xaaaaff, "Local");
layer.addDataSet(data1, 0x6666ff, "International");
// Add the remaining data sets to the chart as another stacked bar group
layer.addDataGroup("2002");
layer.addDataSet(data2, 0xffaaaa, "Local");
layer.addDataSet(data3, 0xff6666, "International");
// Set the sub-bar gap to 0, so there is no gap between stacked bars with a group
layer.setBarGap(0.2, 0);
// Set the bar border to transparent
layer.setBorderColor(Chart.Transparent);
// Set the aggregate label format
layer.setAggregateLabelFormat("Year {dataGroupName}\n{value} millions");
// Set the aggregate label font to 8 point Arial Bold Italic
layer.setAggregateLabelStyle("Arial Bold Italic", 8);
// Reverse 20% space at the right during auto-scaling to allow space for the aggregate
// bar labels
c.yAxis().setAutoScale(0.2);
// Add a legend box at (310, 300) using TopCenter alignment, with 2 column grid layout,
// and use 8pt Arial Bold Italic as font
LegendBox legendBox = c.addLegend2(310, 300, 2, "Arial Bold Italic", 8);
legendBox.setAlignment(Chart.TopCenter);
// Set the format of the text displayed in the legend box
legendBox.setText("Year {dataGroupName} {dataSetName} Revenue");
// Set the background and border of the legend box to transparent
legendBox.setBackground(Chart.Transparent, Chart.Transparent);
// Output the chart
viewer.Chart = c;
//include tool tip for the chart
viewer.ImageMap = c.getHTMLImageMap("clickable", "",
"title='Year {dataGroupName} {dataSetName} {xLabel} Revenue: {value} millions'");
}
}
}
[Windows Forms - VB Version] NetWinCharts\VBNetWinCharts\multistackbar.vb
Imports System
Imports Microsoft.VisualBasic
Imports ChartDirector

Public Class multistackbar
    Implements DemoModule

    'Name of demo module
    Public Function getName() As String Implements DemoModule.getName
        Return "Multi-Stacked Bar Chart"
    End Function

    'Number of charts produced in this demo module
    Public Function getNoOfCharts() As Integer Implements DemoModule.getNoOfCharts
        Return 1
    End Function

    'Main code for creating chart.
    'Note: the argument chartIndex is unused because this demo only has 1 chart.
    Public Sub createChart(viewer As WinChartViewer, chartIndex As Integer) _
        Implements DemoModule.createChart

        ' The data for the bar chart
        Dim data0() As Double = {44, 55, 100}
        Dim data1() As Double = {97, 87, 167}
        Dim data2() As Double = {156, 78, 147}
        Dim data3() As Double = {125, 118, 211}

        ' The labels for the bar chart. The labels contains embedded images as icons.
        Dim labels() As String = {"<*img=@/service.png*><*br*>Service", _
            "<*img=@/software.png*><*br*>Software", "<*img=@/computer.png*><*br*>Hardware"}

        ' Create a XYChart object of size 600 x 350 pixels, using 0xe0e0ff as the background color,
        ' 0xccccff as the border color, with 1 pixel 3D border effect.
        Dim c As XYChart = New XYChart(600, 350, &He0e0ff, &Hccccff, 1)

        ' Add a title to the chart using 14 points Times Bold Itatic font and light blue (0x9999ff)
        ' as the background color
        c.addTitle("Business Results 2001 vs 2002", "Times New Roman Bold Italic", 14 _
            ).setBackground(&H9999ff)

        ' Set the plotarea at (60, 45) and of size 500 x 210 pixels, using white (0xffffff) as the
        ' background
        c.setPlotArea(60, 45, 500, 210, &Hffffff)

        ' Swap the x and y axes to create a horizontal bar chart
        c.swapXY()

        ' Add a title to the y axis using 11 pt Times Bold Italic as font
        c.yAxis().setTitle("Revenue (millions)", "Times New Roman Bold Italic", 11)

        ' Set the labels on the x axis
        c.xAxis().setLabels(labels)

        ' Disable x-axis ticks by setting the tick length to 0
        c.xAxis().setTickLength(0)

        ' Add a stacked bar layer to the chart
        Dim layer As BarLayer = c.addBarLayer2(Chart.Stack)

        ' Add the first two data sets to the chart as a stacked bar group
        layer.addDataGroup("2001")
        layer.addDataSet(data0, &Haaaaff, "Local")
        layer.addDataSet(data1, &H6666ff, "International")

        ' Add the remaining data sets to the chart as another stacked bar group
        layer.addDataGroup("2002")
        layer.addDataSet(data2, &Hffaaaa, "Local")
        layer.addDataSet(data3, &Hff6666, "International")

        ' Set the sub-bar gap to 0, so there is no gap between stacked bars with a group
        layer.setBarGap(0.2, 0)

        ' Set the bar border to transparent
        layer.setBorderColor(Chart.Transparent)

        ' Set the aggregate label format
        layer.setAggregateLabelFormat("Year {dataGroupName}<*br*>{value} millions")

        ' Set the aggregate label font to 8 point Arial Bold Italic
        layer.setAggregateLabelStyle("Arial Bold Italic", 8)

        ' Reverse 20% space at the right during auto-scaling to allow space for the aggregate bar
        ' labels
        c.yAxis().setAutoScale(0.2)

        ' Add a legend box at (310, 300) using TopCenter alignment, with 2 column grid layout, and
        ' use 8pt Arial Bold Italic as font
        Dim legendBox As LegendBox = c.addLegend2(310, 300, 2, "Arial Bold Italic", 8)
        legendBox.setAlignment(Chart.TopCenter)

        ' Set the format of the text displayed in the legend box
        legendBox.setText("Year {dataGroupName} {dataSetName} Revenue")

        ' Set the background and border of the legend box to transparent
        legendBox.setBackground(Chart.Transparent, Chart.Transparent)

        ' Output the chart
        viewer.Chart = c

        'include tool tip for the chart
        viewer.ImageMap = c.getHTMLImageMap("clickable", "", _
            "title='Year {dataGroupName} {dataSetName} {xLabel} Revenue: {value} millions'")

    End Sub

End Class
[WPF - C#] NetWPFCharts\CSharpWPFCharts\multistackbar.cs
using System;
using ChartDirector;

namespace CSharpWPFCharts
{
    public class multistackbar : DemoModule
    {
        //Name of demo module
        public string getName() { return "Multi-Stacked Bar Chart"; }

        //Number of charts produced in this demo module
        public int getNoOfCharts() { return 1; }

        //Main code for creating chart.
        //Note: the argument chartIndex is unused because this demo only has 1 chart.
        public void createChart(WPFChartViewer viewer, int chartIndex)
        {
            // The data for the bar chart
            double[] data0 = {44, 55, 100};
            double[] data1 = {97, 87, 167};
            double[] data2 = {156, 78, 147};
            double[] data3 = {125, 118, 211};

            // The labels for the bar chart. The labels contains embedded images as icons.
            string[] labels = {"<*img=@/images/service.png*><*br*>Service",
                "<*img=@/images/software.png*><*br*>Software",
                "<*img=@/images/computer.png*><*br*>Hardware"};

            // Create a XYChart object of size 600 x 350 pixels, using 0xe0e0ff as the background
            // color, 0xccccff as the border color, with 1 pixel 3D border effect.
            XYChart c = new XYChart(600, 350, 0xe0e0ff, 0xccccff, 1);

            // Add a title to the chart using 14 points Times Bold Itatic font and light blue
            // (0x9999ff) as the background color
            c.addTitle("Business Results 2001 vs 2002", "Times New Roman Bold Italic", 14
                ).setBackground(0x9999ff);

            // Set the plotarea at (60, 45) and of size 500 x 210 pixels, using white (0xffffff) as
            // the background
            c.setPlotArea(60, 45, 500, 210, 0xffffff);

            // Swap the x and y axes to create a horizontal bar chart
            c.swapXY();

            // Add a title to the y axis using 11 pt Times Bold Italic as font
            c.yAxis().setTitle("Revenue (millions)", "Times New Roman Bold Italic", 11);

            // Set the labels on the x axis
            c.xAxis().setLabels(labels);

            // Disable x-axis ticks by setting the tick length to 0
            c.xAxis().setTickLength(0);

            // Add a stacked bar layer to the chart
            BarLayer layer = c.addBarLayer2(Chart.Stack);

            // Add the first two data sets to the chart as a stacked bar group
            layer.addDataGroup("2001");
            layer.addDataSet(data0, 0xaaaaff, "Local");
            layer.addDataSet(data1, 0x6666ff, "International");

            // Add the remaining data sets to the chart as another stacked bar group
            layer.addDataGroup("2002");
            layer.addDataSet(data2, 0xffaaaa, "Local");
            layer.addDataSet(data3, 0xff6666, "International");

            // Set the sub-bar gap to 0, so there is no gap between stacked bars with a group
            layer.setBarGap(0.2, 0);

            // Set the bar border to transparent
            layer.setBorderColor(Chart.Transparent);

            // Set the aggregate label format
            layer.setAggregateLabelFormat("Year {dataGroupName}\n{value} millions");

            // Set the aggregate label font to 8 point Arial Bold Italic
            layer.setAggregateLabelStyle("Arial Bold Italic", 8);

            // Reverse 20% space at the right during auto-scaling to allow space for the aggregate
            // bar labels
            c.yAxis().setAutoScale(0.2);

            // Add a legend box at (310, 300) using TopCenter alignment, with 2 column grid layout,
            // and use 8pt Arial Bold Italic as font
            LegendBox legendBox = c.addLegend2(310, 300, 2, "Arial Bold Italic", 8);
            legendBox.setAlignment(Chart.TopCenter);

            // Set the format of the text displayed in the legend box
            legendBox.setText("Year {dataGroupName} {dataSetName} Revenue");

            // Set the background and border of the legend box to transparent
            legendBox.setBackground(Chart.Transparent, Chart.Transparent);

            // Output the chart
            viewer.Chart = c;

            //include tool tip for the chart
            viewer.ImageMap = c.getHTMLImageMap("clickable", "",
                "title='Year {dataGroupName} {dataSetName} {xLabel} Revenue: {value} millions'");
        }
    }
}
[ASP.NET Web Forms - C# version] NetWebCharts\CSharpASP\multistackbar.aspx
(Click here on how to convert this code to code-behind style.)<%@ Page Language="C#" Debug="true" %>
<%@ Import Namespace="ChartDirector" %>
<%@ Register TagPrefix="chart" Namespace="ChartDirector" Assembly="netchartdir" %>
<!DOCTYPE html>
<script runat="server">
//
// Page Load event handler
//
protected void Page_Load(object sender, EventArgs e)
{
// The data for the bar chart
double[] data0 = {44, 55, 100};
double[] data1 = {97, 87, 167};
double[] data2 = {156, 78, 147};
double[] data3 = {125, 118, 211};
// The labels for the bar chart. The labels contains embedded images as icons.
string[] labels = {"<*img=service.png*><*br*>Service", "<*img=software.png*><*br*>Software",
"<*img=computer.png*><*br*>Hardware"};
// Create a XYChart object of size 600 x 350 pixels, using 0xe0e0ff as the background color,
// 0xccccff as the border color, with 1 pixel 3D border effect.
XYChart c = new XYChart(600, 350, 0xe0e0ff, 0xccccff, 1);
//Set default directory for loading images from current script directory
c.setSearchPath(Server.MapPath("."));
// Add a title to the chart using 14 points Times Bold Itatic font and light blue (0x9999ff) as
// the background color
c.addTitle("Business Results 2001 vs 2002", "Times New Roman Bold Italic", 14).setBackground(
0x9999ff);
// Set the plotarea at (60, 45) and of size 500 x 210 pixels, using white (0xffffff) as the
// background
c.setPlotArea(60, 45, 500, 210, 0xffffff);
// Swap the x and y axes to create a horizontal bar chart
c.swapXY();
// Add a title to the y axis using 11 pt Times Bold Italic as font
c.yAxis().setTitle("Revenue (millions)", "Times New Roman Bold Italic", 11);
// Set the labels on the x axis
c.xAxis().setLabels(labels);
// Disable x-axis ticks by setting the tick length to 0
c.xAxis().setTickLength(0);
// Add a stacked bar layer to the chart
BarLayer layer = c.addBarLayer2(Chart.Stack);
// Add the first two data sets to the chart as a stacked bar group
layer.addDataGroup("2001");
layer.addDataSet(data0, 0xaaaaff, "Local");
layer.addDataSet(data1, 0x6666ff, "International");
// Add the remaining data sets to the chart as another stacked bar group
layer.addDataGroup("2002");
layer.addDataSet(data2, 0xffaaaa, "Local");
layer.addDataSet(data3, 0xff6666, "International");
// Set the sub-bar gap to 0, so there is no gap between stacked bars with a group
layer.setBarGap(0.2, 0);
// Set the bar border to transparent
layer.setBorderColor(Chart.Transparent);
// Set the aggregate label format
layer.setAggregateLabelFormat("Year {dataGroupName}\n{value} millions");
// Set the aggregate label font to 8 point Arial Bold Italic
layer.setAggregateLabelStyle("Arial Bold Italic", 8);
// Reverse 20% space at the right during auto-scaling to allow space for the aggregate bar
// labels
c.yAxis().setAutoScale(0.2);
// Add a legend box at (310, 300) using TopCenter alignment, with 2 column grid layout, and use
// 8pt Arial Bold Italic as font
LegendBox legendBox = c.addLegend2(310, 300, 2, "Arial Bold Italic", 8);
legendBox.setAlignment(Chart.TopCenter);
// Set the format of the text displayed in the legend box
legendBox.setText("Year {dataGroupName} {dataSetName} Revenue");
// Set the background and border of the legend box to transparent
legendBox.setBackground(Chart.Transparent, Chart.Transparent);
// Output the chart
WebChartViewer1.Image = c.makeWebImage(Chart.SVG);
// Include tool tip for the chart
WebChartViewer1.ImageMap = c.getHTMLImageMap("", "",
"title='Year {dataGroupName} {dataSetName} {xLabel} Revenue: {value} millions'");
}
</script>
<html>
<head>
<script type="text/javascript" src="cdjcv.js"></script>
</head>
<body>
<chart:WebChartViewer id="WebChartViewer1" runat="server" />
</body>
</html>
[ASP.NET Web Forms - VB Version] NetWebCharts\VBNetASP\multistackbar.aspx
(Click here on how to convert this code to code-behind style.)<%@ Page Language="VB" Debug="true" %>
<%@ Import Namespace="ChartDirector" %>
<%@ Register TagPrefix="chart" Namespace="ChartDirector" Assembly="netchartdir" %>
<!DOCTYPE html>
<script runat="server">
'
' Page Load event handler
'
Protected Sub Page_Load(ByVal sender As System.Object, ByVal e As System.EventArgs)
' The data for the bar chart
Dim data0() As Double = {44, 55, 100}
Dim data1() As Double = {97, 87, 167}
Dim data2() As Double = {156, 78, 147}
Dim data3() As Double = {125, 118, 211}
' The labels for the bar chart. The labels contains embedded images as icons.
Dim labels() As String = {"<*img=service.png*><*br*>Service", _
"<*img=software.png*><*br*>Software", "<*img=computer.png*><*br*>Hardware"}
' Create a XYChart object of size 600 x 350 pixels, using 0xe0e0ff as the background color,
' 0xccccff as the border color, with 1 pixel 3D border effect.
Dim c As XYChart = New XYChart(600, 350, &He0e0ff, &Hccccff, 1)
' Set default directory for loading images from current script directory
Call c.setSearchPath(Server.MapPath("."))
' Add a title to the chart using 14 points Times Bold Itatic font and light blue (0x9999ff) as
' the background color
c.addTitle("Business Results 2001 vs 2002", "Times New Roman Bold Italic", 14).setBackground( _
&H9999ff)
' Set the plotarea at (60, 45) and of size 500 x 210 pixels, using white (0xffffff) as the
' background
c.setPlotArea(60, 45, 500, 210, &Hffffff)
' Swap the x and y axes to create a horizontal bar chart
c.swapXY()
' Add a title to the y axis using 11 pt Times Bold Italic as font
c.yAxis().setTitle("Revenue (millions)", "Times New Roman Bold Italic", 11)
' Set the labels on the x axis
c.xAxis().setLabels(labels)
' Disable x-axis ticks by setting the tick length to 0
c.xAxis().setTickLength(0)
' Add a stacked bar layer to the chart
Dim layer As BarLayer = c.addBarLayer2(Chart.Stack)
' Add the first two data sets to the chart as a stacked bar group
layer.addDataGroup("2001")
layer.addDataSet(data0, &Haaaaff, "Local")
layer.addDataSet(data1, &H6666ff, "International")
' Add the remaining data sets to the chart as another stacked bar group
layer.addDataGroup("2002")
layer.addDataSet(data2, &Hffaaaa, "Local")
layer.addDataSet(data3, &Hff6666, "International")
' Set the sub-bar gap to 0, so there is no gap between stacked bars with a group
layer.setBarGap(0.2, 0)
' Set the bar border to transparent
layer.setBorderColor(Chart.Transparent)
' Set the aggregate label format
layer.setAggregateLabelFormat("Year {dataGroupName}<*br*>{value} millions")
' Set the aggregate label font to 8 point Arial Bold Italic
layer.setAggregateLabelStyle("Arial Bold Italic", 8)
' Reverse 20% space at the right during auto-scaling to allow space for the aggregate bar labels
c.yAxis().setAutoScale(0.2)
' Add a legend box at (310, 300) using TopCenter alignment, with 2 column grid layout, and use
' 8pt Arial Bold Italic as font
Dim legendBox As LegendBox = c.addLegend2(310, 300, 2, "Arial Bold Italic", 8)
legendBox.setAlignment(Chart.TopCenter)
' Set the format of the text displayed in the legend box
legendBox.setText("Year {dataGroupName} {dataSetName} Revenue")
' Set the background and border of the legend box to transparent
legendBox.setBackground(Chart.Transparent, Chart.Transparent)
' Output the chart
WebChartViewer1.Image = c.makeWebImage(Chart.SVG)
' Include tool tip for the chart
WebChartViewer1.ImageMap = c.getHTMLImageMap("", "", _
"title='Year {dataGroupName} {dataSetName} {xLabel} Revenue: {value} millions'")
End Sub
</script>
<html>
<head>
<script type="text/javascript" src="cdjcv.js"></script>
</head>
<body>
<chart:WebChartViewer id="WebChartViewer1" runat="server" />
</body>
</html>
[ASP.NET MVC - Controller] NetMvcCharts\Controllers\MultistackbarController.cs
using System;
using System.Web.Mvc;
using ChartDirector;

namespace NetMvcCharts.Controllers
{
    public class MultistackbarController : Controller
    {
        //
        // Default Action
        //
        public ActionResult Index()
        {
            ViewBag.Title = "Multi-Stacked Bar Chart";
            createChart(ViewBag.Viewer = new RazorChartViewer(HttpContext, "chart1"));
            return View("~/Views/Shared/ChartView.cshtml");
        }

        //
        // Create chart
        //
        private void createChart(RazorChartViewer viewer)
        {
            // The data for the bar chart
            double[] data0 = {44, 55, 100};
            double[] data1 = {97, 87, 167};
            double[] data2 = {156, 78, 147};
            double[] data3 = {125, 118, 211};

            // The labels for the bar chart. The labels contains embedded images as icons.
            string[] labels = {"<*img=service.png*><*br*>Service", "<*img=software.png*><*br*>Software",
                "<*img=computer.png*><*br*>Hardware"};

            // Create a XYChart object of size 600 x 350 pixels, using 0xe0e0ff as the background color,
            // 0xccccff as the border color, with 1 pixel 3D border effect.
            XYChart c = new XYChart(600, 350, 0xe0e0ff, 0xccccff, 1);

            //Set default directory for loading images
            c.setSearchPath(Url.Content("~/Content"));

            // Add a title to the chart using 14 points Times Bold Itatic font and light blue (0x9999ff)
            // as the background color
            c.addTitle("Business Results 2001 vs 2002", "Times New Roman Bold Italic", 14).setBackground(
                0x9999ff);

            // Set the plotarea at (60, 45) and of size 500 x 210 pixels, using white (0xffffff) as the
            // background
            c.setPlotArea(60, 45, 500, 210, 0xffffff);

            // Swap the x and y axes to create a horizontal bar chart
            c.swapXY();

            // Add a title to the y axis using 11 pt Times Bold Italic as font
            c.yAxis().setTitle("Revenue (millions)", "Times New Roman Bold Italic", 11);

            // Set the labels on the x axis
            c.xAxis().setLabels(labels);

            // Disable x-axis ticks by setting the tick length to 0
            c.xAxis().setTickLength(0);

            // Add a stacked bar layer to the chart
            BarLayer layer = c.addBarLayer2(Chart.Stack);

            // Add the first two data sets to the chart as a stacked bar group
            layer.addDataGroup("2001");
            layer.addDataSet(data0, 0xaaaaff, "Local");
            layer.addDataSet(data1, 0x6666ff, "International");

            // Add the remaining data sets to the chart as another stacked bar group
            layer.addDataGroup("2002");
            layer.addDataSet(data2, 0xffaaaa, "Local");
            layer.addDataSet(data3, 0xff6666, "International");

            // Set the sub-bar gap to 0, so there is no gap between stacked bars with a group
            layer.setBarGap(0.2, 0);

            // Set the bar border to transparent
            layer.setBorderColor(Chart.Transparent);

            // Set the aggregate label format
            layer.setAggregateLabelFormat("Year {dataGroupName}\n{value} millions");

            // Set the aggregate label font to 8 point Arial Bold Italic
            layer.setAggregateLabelStyle("Arial Bold Italic", 8);

            // Reverse 20% space at the right during auto-scaling to allow space for the aggregate bar
            // labels
            c.yAxis().setAutoScale(0.2);

            // Add a legend box at (310, 300) using TopCenter alignment, with 2 column grid layout, and
            // use 8pt Arial Bold Italic as font
            LegendBox legendBox = c.addLegend2(310, 300, 2, "Arial Bold Italic", 8);
            legendBox.setAlignment(Chart.TopCenter);

            // Set the format of the text displayed in the legend box
            legendBox.setText("Year {dataGroupName} {dataSetName} Revenue");

            // Set the background and border of the legend box to transparent
            legendBox.setBackground(Chart.Transparent, Chart.Transparent);

            // Output the chart
            viewer.Image = c.makeWebImage(Chart.SVG);

            // Include tool tip for the chart
            viewer.ImageMap = c.getHTMLImageMap("", "",
                "title='Year {dataGroupName} {dataSetName} {xLabel} Revenue: {value} millions'");
        }
    }
}
[ASP.NET MVC - View] NetMvcCharts\Views\Shared\ChartView.cshtml
@{ Layout = null; }

<!DOCTYPE html>

<html>
<head>
    <meta name="viewport" content="width=device-width" />
    <title>@ViewBag.Title</title>
    <style>
        @ViewBag.Style
    </style>
    @Scripts.Render("~/Scripts/cdjcv.js")
</head>
<body style="margin:5px 0px 0px 5px">
    <div style="font:bold 18pt verdana;">
        @ViewBag.Title
    </div>
    <hr style="border:solid 1px #000080; background:#000080" />
    <div>
        @{
            if (ViewBag.Viewer is Array)
            {
                // Display multiple charts
                for (int i = 0; i < ViewBag.Viewer.Length; ++i)
                {
                    @:@Html.Raw(ViewBag.Viewer[i].RenderHTML())
                }
            }
            else
            {
                // Display one chart only
                @:@Html.Raw(ViewBag.Viewer.RenderHTML())
            }
        }
    </div>
</body>
</html>
© 2023 Advanced Software Engineering Limited. All rights reserved.