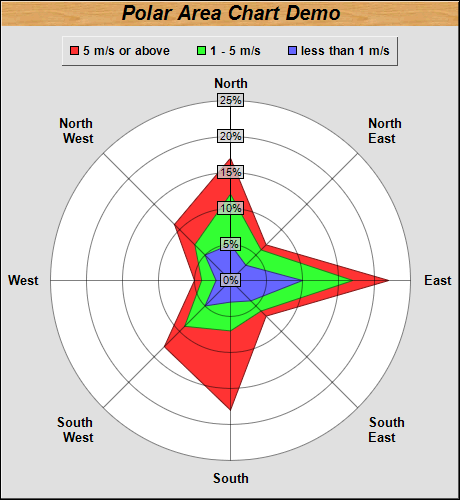
This examples demonstrates a polar area chart.
The polar area layer is created using PolarChart.addAreaLayer. In this example, 3 area layers are used. The area data are already stacked before passing to ChartDirector.
ChartDirector 7.1 (.NET Edition)
Polar Area Chart
Source Code Listing
using System;
using ChartDirector;

namespace CSharpChartExplorer
{
    public class polararea : DemoModule
    {
        //Name of demo module
        public string getName() { return "Polar Area Chart"; }

        //Number of charts produced in this demo module
        public int getNoOfCharts() { return 1; }

        //Main code for creating chart.
        //Note: the argument chartIndex is unused because this demo only has 1 chart.
        public void createChart(WinChartViewer viewer, int chartIndex)
        {
            // Data for the chart
            double[] data0 = {5, 3, 10, 4, 3, 5, 2, 5};
            double[] data1 = {12, 6, 17, 6, 7, 9, 4, 7};
            double[] data2 = {17, 7, 22, 7, 18, 13, 5, 11};

            string[] labels = {"North", "North<*br*>East", "East", "South<*br*>East", "South",
                "South<*br*>West", "West", "North<*br*>West"};

            // Create a PolarChart object of size 460 x 500 pixels, with a grey (e0e0e0) background
            // and 1 pixel 3D border
            PolarChart c = new PolarChart(460, 500, 0xe0e0e0, 0x000000, 1);

            // Add a title to the chart at the top left corner using 15pt Arial Bold Italic font.
            // Use a wood pattern as the title background.
            c.addTitle("Polar Area Chart Demo", "Arial Bold Italic", 15).setBackground(
                c.patternColor("@/images/wood.png"));

            // Set center of plot area at (230, 280) with radius 180 pixels, and white (ffffff)
            // background.
            c.setPlotArea(230, 280, 180, 0xffffff);

            // Set the grid style to circular grid
            c.setGridStyle(false);

            // Add a legend box at top-center of plot area (230, 35) using horizontal layout. Use
            // 10pt Arial Bold font, with 1 pixel 3D border effect.
            LegendBox b = c.addLegend(230, 35, false, "Arial Bold", 9);
            b.setAlignment(Chart.TopCenter);
            b.setBackground(Chart.Transparent, Chart.Transparent, 1);

            // Set angular axis using the given labels
            c.angularAxis().setLabels(labels);

            // Specify the label format for the radial axis
            c.radialAxis().setLabelFormat("{value}%");

            // Set radial axis label background to semi-transparent grey (40cccccc)
            c.radialAxis().setLabelStyle().setBackground(0x40cccccc, 0);

            // Add the data as area layers
            c.addAreaLayer(data2, -1, "5 m/s or above");
            c.addAreaLayer(data1, -1, "1 - 5 m/s");
            c.addAreaLayer(data0, -1, "less than 1 m/s");

            // Output the chart
            viewer.Chart = c;

            //include tool tip for the chart
            viewer.ImageMap = c.getHTMLImageMap("clickable", "",
                "title='[{label}] {dataSetName}: {value}%'");
        }
    }
}Imports System
Imports Microsoft.VisualBasic
Imports ChartDirector
Public Class polararea
Implements DemoModule
'Name of demo module
Public Function getName() As String Implements DemoModule.getName
Return "Polar Area Chart"
End Function
'Number of charts produced in this demo module
Public Function getNoOfCharts() As Integer Implements DemoModule.getNoOfCharts
Return 1
End Function
'Main code for creating chart.
'Note: the argument chartIndex is unused because this demo only has 1 chart.
Public Sub createChart(viewer As WinChartViewer, chartIndex As Integer) _
Implements DemoModule.createChart
' Data for the chart
Dim data0() As Double = {5, 3, 10, 4, 3, 5, 2, 5}
Dim data1() As Double = {12, 6, 17, 6, 7, 9, 4, 7}
Dim data2() As Double = {17, 7, 22, 7, 18, 13, 5, 11}
Dim labels() As String = {"North", "North<*br*>East", "East", "South<*br*>East", "South", _
"South<*br*>West", "West", "North<*br*>West"}
' Create a PolarChart object of size 460 x 500 pixels, with a grey (e0e0e0) background and 1
' pixel 3D border
Dim c As PolarChart = New PolarChart(460, 500, &He0e0e0, &H000000, 1)
' Add a title to the chart at the top left corner using 15pt Arial Bold Italic font. Use a
' wood pattern as the title background.
c.addTitle("Polar Area Chart Demo", "Arial Bold Italic", 15).setBackground(c.patternColor( _
"@/wood.png"))
' Set center of plot area at (230, 280) with radius 180 pixels, and white (ffffff)
' background.
c.setPlotArea(230, 280, 180, &Hffffff)
' Set the grid style to circular grid
c.setGridStyle(False)
' Add a legend box at top-center of plot area (230, 35) using horizontal layout. Use 10pt
' Arial Bold font, with 1 pixel 3D border effect.
Dim b As LegendBox = c.addLegend(230, 35, False, "Arial Bold", 9)
b.setAlignment(Chart.TopCenter)
b.setBackground(Chart.Transparent, Chart.Transparent, 1)
' Set angular axis using the given labels
c.angularAxis().setLabels(labels)
' Specify the label format for the radial axis
c.radialAxis().setLabelFormat("{value}%")
' Set radial axis label background to semi-transparent grey (40cccccc)
c.radialAxis().setLabelStyle().setBackground(&H40cccccc, 0)
' Add the data as area layers
c.addAreaLayer(data2, -1, "5 m/s or above")
c.addAreaLayer(data1, -1, "1 - 5 m/s")
c.addAreaLayer(data0, -1, "less than 1 m/s")
' Output the chart
viewer.Chart = c
'include tool tip for the chart
viewer.ImageMap = c.getHTMLImageMap("clickable", "", _
"title='[{label}] {dataSetName}: {value}%'")
End Sub
End Classusing System;
using ChartDirector;
namespace CSharpWPFCharts
{
public class polararea : DemoModule
{
//Name of demo module
public string getName() { return "Polar Area Chart"; }
//Number of charts produced in this demo module
public int getNoOfCharts() { return 1; }
//Main code for creating chart.
//Note: the argument chartIndex is unused because this demo only has 1 chart.
public void createChart(WPFChartViewer viewer, int chartIndex)
{
// Data for the chart
double[] data0 = {5, 3, 10, 4, 3, 5, 2, 5};
double[] data1 = {12, 6, 17, 6, 7, 9, 4, 7};
double[] data2 = {17, 7, 22, 7, 18, 13, 5, 11};
string[] labels = {"North", "North<*br*>East", "East", "South<*br*>East", "South",
"South<*br*>West", "West", "North<*br*>West"};
// Create a PolarChart object of size 460 x 500 pixels, with a grey (e0e0e0) background
// and 1 pixel 3D border
PolarChart c = new PolarChart(460, 500, 0xe0e0e0, 0x000000, 1);
// Add a title to the chart at the top left corner using 15pt Arial Bold Italic font.
// Use a wood pattern as the title background.
c.addTitle("Polar Area Chart Demo", "Arial Bold Italic", 15).setBackground(
c.patternColor("@/images/wood.png"));
// Set center of plot area at (230, 280) with radius 180 pixels, and white (ffffff)
// background.
c.setPlotArea(230, 280, 180, 0xffffff);
// Set the grid style to circular grid
c.setGridStyle(false);
// Add a legend box at top-center of plot area (230, 35) using horizontal layout. Use
// 10pt Arial Bold font, with 1 pixel 3D border effect.
LegendBox b = c.addLegend(230, 35, false, "Arial Bold", 9);
b.setAlignment(Chart.TopCenter);
b.setBackground(Chart.Transparent, Chart.Transparent, 1);
// Set angular axis using the given labels
c.angularAxis().setLabels(labels);
// Specify the label format for the radial axis
c.radialAxis().setLabelFormat("{value}%");
// Set radial axis label background to semi-transparent grey (40cccccc)
c.radialAxis().setLabelStyle().setBackground(0x40cccccc, 0);
// Add the data as area layers
c.addAreaLayer(data2, -1, "5 m/s or above");
c.addAreaLayer(data1, -1, "1 - 5 m/s");
c.addAreaLayer(data0, -1, "less than 1 m/s");
// Output the chart
viewer.Chart = c;
//include tool tip for the chart
viewer.ImageMap = c.getHTMLImageMap("clickable", "",
"title='[{label}] {dataSetName}: {value}%'");
}
}
}<%@ Page Language="C#" Debug="true" %>
<%@ Import Namespace="ChartDirector" %>
<%@ Register TagPrefix="chart" Namespace="ChartDirector" Assembly="netchartdir" %>
<!DOCTYPE html>
<script runat="server">
//
// Page Load event handler
//
protected void Page_Load(object sender, EventArgs e)
{
// Data for the chart
double[] data0 = {5, 3, 10, 4, 3, 5, 2, 5};
double[] data1 = {12, 6, 17, 6, 7, 9, 4, 7};
double[] data2 = {17, 7, 22, 7, 18, 13, 5, 11};
string[] labels = {"North", "North<*br*>East", "East", "South<*br*>East", "South",
"South<*br*>West", "West", "North<*br*>West"};
// Create a PolarChart object of size 460 x 500 pixels, with a grey (e0e0e0) background and 1
// pixel 3D border
PolarChart c = new PolarChart(460, 500, 0xe0e0e0, 0x000000, 1);
// Add a title to the chart at the top left corner using 15pt Arial Bold Italic font. Use a wood
// pattern as the title background.
c.addTitle("Polar Area Chart Demo", "Arial Bold Italic", 15).setBackground(c.patternColor(
Server.MapPath("wood.png")));
// Set center of plot area at (230, 280) with radius 180 pixels, and white (ffffff) background.
c.setPlotArea(230, 280, 180, 0xffffff);
// Set the grid style to circular grid
c.setGridStyle(false);
// Add a legend box at top-center of plot area (230, 35) using horizontal layout. Use 10pt Arial
// Bold font, with 1 pixel 3D border effect.
LegendBox b = c.addLegend(230, 35, false, "Arial Bold", 9);
b.setAlignment(Chart.TopCenter);
b.setBackground(Chart.Transparent, Chart.Transparent, 1);
// Set angular axis using the given labels
c.angularAxis().setLabels(labels);
// Specify the label format for the radial axis
c.radialAxis().setLabelFormat("{value}%");
// Set radial axis label background to semi-transparent grey (40cccccc)
c.radialAxis().setLabelStyle().setBackground(0x40cccccc, 0);
// Add the data as area layers
c.addAreaLayer(data2, -1, "5 m/s or above");
c.addAreaLayer(data1, -1, "1 - 5 m/s");
c.addAreaLayer(data0, -1, "less than 1 m/s");
// Output the chart
WebChartViewer1.Image = c.makeWebImage(Chart.SVG);
// Include tool tip for the chart
WebChartViewer1.ImageMap = c.getHTMLImageMap("", "", "title='[{label}] {dataSetName}: {value}%'"
);
}
</script>
<html>
<head>
<script type="text/javascript" src="cdjcv.js"></script>
</head>
<body>
<chart:WebChartViewer id="WebChartViewer1" runat="server" />
</body>
</html><%@ Page Language="VB" Debug="true" %>
<%@ Import Namespace="ChartDirector" %>
<%@ Register TagPrefix="chart" Namespace="ChartDirector" Assembly="netchartdir" %>
<!DOCTYPE html>
<script runat="server">
'
' Page Load event handler
'
Protected Sub Page_Load(ByVal sender As System.Object, ByVal e As System.EventArgs)
' Data for the chart
Dim data0() As Double = {5, 3, 10, 4, 3, 5, 2, 5}
Dim data1() As Double = {12, 6, 17, 6, 7, 9, 4, 7}
Dim data2() As Double = {17, 7, 22, 7, 18, 13, 5, 11}
Dim labels() As String = {"North", "North<*br*>East", "East", "South<*br*>East", "South", _
"South<*br*>West", "West", "North<*br*>West"}
' Create a PolarChart object of size 460 x 500 pixels, with a grey (e0e0e0) background and 1
' pixel 3D border
Dim c As PolarChart = New PolarChart(460, 500, &He0e0e0, &H000000, 1)
' Add a title to the chart at the top left corner using 15pt Arial Bold Italic font. Use a wood
' pattern as the title background.
c.addTitle("Polar Area Chart Demo", "Arial Bold Italic", 15).setBackground(c.patternColor( _
Server.MapPath("wood.png")))
' Set center of plot area at (230, 280) with radius 180 pixels, and white (ffffff) background.
c.setPlotArea(230, 280, 180, &Hffffff)
' Set the grid style to circular grid
c.setGridStyle(False)
' Add a legend box at top-center of plot area (230, 35) using horizontal layout. Use 10pt Arial
' Bold font, with 1 pixel 3D border effect.
Dim b As LegendBox = c.addLegend(230, 35, False, "Arial Bold", 9)
b.setAlignment(Chart.TopCenter)
b.setBackground(Chart.Transparent, Chart.Transparent, 1)
' Set angular axis using the given labels
c.angularAxis().setLabels(labels)
' Specify the label format for the radial axis
c.radialAxis().setLabelFormat("{value}%")
' Set radial axis label background to semi-transparent grey (40cccccc)
c.radialAxis().setLabelStyle().setBackground(&H40cccccc, 0)
' Add the data as area layers
c.addAreaLayer(data2, -1, "5 m/s or above")
c.addAreaLayer(data1, -1, "1 - 5 m/s")
c.addAreaLayer(data0, -1, "less than 1 m/s")
' Output the chart
WebChartViewer1.Image = c.makeWebImage(Chart.SVG)
' Include tool tip for the chart
WebChartViewer1.ImageMap = c.getHTMLImageMap("", "", _
"title='[{label}] {dataSetName}: {value}%'")
End Sub
</script>
<html>
<head>
<script type="text/javascript" src="cdjcv.js"></script>
</head>
<body>
<chart:WebChartViewer id="WebChartViewer1" runat="server" />
</body>
</html>using System;
using System.Web.Mvc;
using ChartDirector;
namespace NetMvcCharts.Controllers
{
public class PolarareaController : Controller
{
//
// Default Action
//
public ActionResult Index()
{
ViewBag.Title = "Polar Area Chart";
createChart(ViewBag.Viewer = new RazorChartViewer(HttpContext, "chart1"));
return View("~/Views/Shared/ChartView.cshtml");
}
//
// Create chart
//
private void createChart(RazorChartViewer viewer)
{
// Data for the chart
double[] data0 = {5, 3, 10, 4, 3, 5, 2, 5};
double[] data1 = {12, 6, 17, 6, 7, 9, 4, 7};
double[] data2 = {17, 7, 22, 7, 18, 13, 5, 11};
string[] labels = {"North", "North<*br*>East", "East", "South<*br*>East", "South",
"South<*br*>West", "West", "North<*br*>West"};
// Create a PolarChart object of size 460 x 500 pixels, with a grey (e0e0e0) background and 1
// pixel 3D border
PolarChart c = new PolarChart(460, 500, 0xe0e0e0, 0x000000, 1);
// Add a title to the chart at the top left corner using 15pt Arial Bold Italic font. Use a
// wood pattern as the title background.
c.addTitle("Polar Area Chart Demo", "Arial Bold Italic", 15).setBackground(c.patternColor(
Url.Content("~/Content/wood.png")));
// Set center of plot area at (230, 280) with radius 180 pixels, and white (ffffff)
// background.
c.setPlotArea(230, 280, 180, 0xffffff);
// Set the grid style to circular grid
c.setGridStyle(false);
// Add a legend box at top-center of plot area (230, 35) using horizontal layout. Use 10pt
// Arial Bold font, with 1 pixel 3D border effect.
LegendBox b = c.addLegend(230, 35, false, "Arial Bold", 9);
b.setAlignment(Chart.TopCenter);
b.setBackground(Chart.Transparent, Chart.Transparent, 1);
// Set angular axis using the given labels
c.angularAxis().setLabels(labels);
// Specify the label format for the radial axis
c.radialAxis().setLabelFormat("{value}%");
// Set radial axis label background to semi-transparent grey (40cccccc)
c.radialAxis().setLabelStyle().setBackground(0x40cccccc, 0);
// Add the data as area layers
c.addAreaLayer(data2, -1, "5 m/s or above");
c.addAreaLayer(data1, -1, "1 - 5 m/s");
c.addAreaLayer(data0, -1, "less than 1 m/s");
// Output the chart
viewer.Image = c.makeWebImage(Chart.SVG);
// Include tool tip for the chart
viewer.ImageMap = c.getHTMLImageMap("", "",
"title='[{label}] {dataSetName}: {value}%'");
}
}
}@{ Layout = null; }
<!DOCTYPE html>
<html>
<head>
<meta name="viewport" content="width=device-width" />
<title>@ViewBag.Title</title>
<style>
@ViewBag.Style
</style>
@Scripts.Render("~/Scripts/cdjcv.js")
</head>
<body style="margin:5px 0px 0px 5px">
<div style="font:bold 18pt verdana;">
@ViewBag.Title
</div>
<hr style="border:solid 1px #000080; background:#000080" />
<div>
@{
if (ViewBag.Viewer is Array)
{
// Display multiple charts
for (int i = 0; i < ViewBag.Viewer.Length; ++i)
{
@:@Html.Raw(ViewBag.Viewer[i].RenderHTML())
}
}
else
{
// Display one chart only
@:@Html.Raw(ViewBag.Viewer.RenderHTML())
}
}
</div>
</body>
</html>