[Windows Forms - C# version] NetWinCharts\CSharpWinCharts\polarzones2.cs
using System;
using ChartDirector;
namespace CSharpChartExplorer
{
public class polarzones2 : DemoModule
{
//Name of demo module
public string getName() { return "Sector Zones"; }
//Number of charts produced in this demo module
public int getNoOfCharts() { return 1; }
//Main code for creating chart.
//Note: the argument chartIndex is unused because this demo only has 1 chart.
public void createChart(WinChartViewer viewer, int chartIndex)
{
// The data for the chart
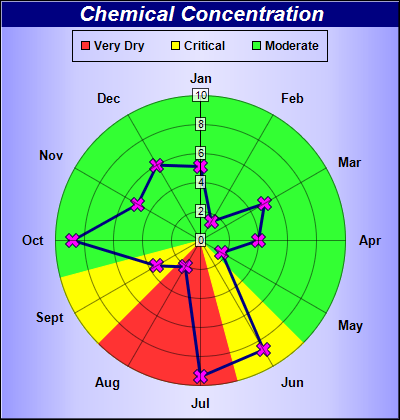
double[] data = {5.1, 1.5, 5.1, 4.0, 1.7, 8.7, 9.4, 2.1, 3.5, 8.8, 5.0, 6.0};
// The labels for the chart
string[] labels = {"Jan", "Feb", "Mar", "Apr", "May", "Jun", "Jul", "Aug", "Sept",
"Oct", "Nov", "Dec"};
// Create a PolarChart object of size 400 x 420 pixels. with a metallic blue (9999ff)
// background color and 1 pixel 3D border
PolarChart c = new PolarChart(400, 420, Chart.metalColor(0x9999ff), 0x000000, 1);
// Add a title to the chart using 16pt Arial Bold Italic font. The title text is white
// (0xffffff) on deep blue (000080) background
c.addTitle("Chemical Concentration", "Arial Bold Italic", 16, 0xffffff).setBackground(
0x000080);
// Set center of plot area at (200, 240) with radius 145 pixels. Set background color to
// green (0x33ff33)
c.setPlotArea(200, 240, 145, 0x33ff33);
// Set the labels to the angular axis
c.angularAxis().setLabels(labels);
// Color the sector between label index = 5.5 to 7.5 as red (ff3333) zone
c.angularAxis().addZone(5.5, 7.5, 0xff3333);
// Color the sector between label index = 4.5 to 5.5, and also between 7.5 to 8.5, as
// yellow (ff3333) zones
c.angularAxis().addZone(4.5, 5.5, 0xffff00);
c.angularAxis().addZone(7.5, 8.5, 0xffff00);
// Set the grid style to circular grid
c.setGridStyle(false);
// Use semi-transparent (40ffffff) label background so as not to block the data
c.radialAxis().setLabelStyle().setBackground(0x40ffffff, 0x40000000);
// Add a legend box at (200, 30) top center aligned, using 9pt Arial Bold font. with a
// black border.
LegendBox legendBox = c.addLegend(200, 30, false, "Arial Bold", 9);
legendBox.setAlignment(Chart.TopCenter);
// Add legend keys to represent the red/yellow/green zones
legendBox.addKey("Very Dry", 0xff3333);
legendBox.addKey("Critical", 0xffff00);
legendBox.addKey("Moderate", 0x33ff33);
// Add a blue (0x80) line layer with line width set to 3 pixels and use purple (ff00ff)
// cross symbols for the data points
PolarLineLayer layer = c.addLineLayer(data, 0x000080);
layer.setLineWidth(3);
layer.setDataSymbol(Chart.Cross2Shape(), 15, 0xff00ff);
// Output the chart
viewer.Chart = c;
// Include tool tip for the chart.
viewer.ImageMap = layer.getHTMLImageMap("clickable", "",
"title='Concentration on {label}: {value} ppm'");
}
}
}
[Windows Forms - VB Version] NetWinCharts\VBNetWinCharts\polarzones2.vb
Imports System
Imports Microsoft.VisualBasic
Imports ChartDirector

Public Class polarzones2
    Implements DemoModule

    'Name of demo module
    Public Function getName() As String Implements DemoModule.getName
        Return "Sector Zones"
    End Function

    'Number of charts produced in this demo module
    Public Function getNoOfCharts() As Integer Implements DemoModule.getNoOfCharts
        Return 1
    End Function

    'Main code for creating chart.
    'Note: the argument chartIndex is unused because this demo only has 1 chart.
    Public Sub createChart(viewer As WinChartViewer, chartIndex As Integer) _
        Implements DemoModule.createChart

        ' The data for the chart
        Dim data() As Double = {5.1, 1.5, 5.1, 4.0, 1.7, 8.7, 9.4, 2.1, 3.5, 8.8, 5.0, 6.0}

        ' The labels for the chart
        Dim labels() As String = {"Jan", "Feb", "Mar", "Apr", "May", "Jun", "Jul", "Aug", "Sept", _
            "Oct", "Nov", "Dec"}

        ' Create a PolarChart object of size 400 x 420 pixels. with a metallic blue (9999ff)
        ' background color and 1 pixel 3D border
        Dim c As PolarChart = New PolarChart(400, 420, Chart.metalColor(&H9999ff), &H000000, 1)

        ' Add a title to the chart using 16pt Arial Bold Italic font. The title text is white
        ' (0xffffff) on deep blue (000080) background
        c.addTitle("Chemical Concentration", "Arial Bold Italic", 16, &Hffffff).setBackground( _
            &H000080)

        ' Set center of plot area at (200, 240) with radius 145 pixels. Set background color to
        ' green (0x33ff33)
        c.setPlotArea(200, 240, 145, &H33ff33)

        ' Set the labels to the angular axis
        c.angularAxis().setLabels(labels)

        ' Color the sector between label index = 5.5 to 7.5 as red (ff3333) zone
        c.angularAxis().addZone(5.5, 7.5, &Hff3333)

        ' Color the sector between label index = 4.5 to 5.5, and also between 7.5 to 8.5, as yellow
        ' (ff3333) zones
        c.angularAxis().addZone(4.5, 5.5, &Hffff00)
        c.angularAxis().addZone(7.5, 8.5, &Hffff00)

        ' Set the grid style to circular grid
        c.setGridStyle(False)

        ' Use semi-transparent (40ffffff) label background so as not to block the data
        c.radialAxis().setLabelStyle().setBackground(&H40ffffff, &H40000000)

        ' Add a legend box at (200, 30) top center aligned, using 9pt Arial Bold font. with a black
        ' border.
        Dim legendBox As LegendBox = c.addLegend(200, 30, False, "Arial Bold", 9)
        legendBox.setAlignment(Chart.TopCenter)

        ' Add legend keys to represent the red/yellow/green zones
        legendBox.addKey("Very Dry", &Hff3333)
        legendBox.addKey("Critical", &Hffff00)
        legendBox.addKey("Moderate", &H33ff33)

        ' Add a blue (0x80) line layer with line width set to 3 pixels and use purple (ff00ff) cross
        ' symbols for the data points
        Dim layer As PolarLineLayer = c.addLineLayer(data, &H000080)
        layer.setLineWidth(3)
        layer.setDataSymbol(Chart.Cross2Shape(), 15, &Hff00ff)

        ' Output the chart
        viewer.Chart = c

        ' Include tool tip for the chart.
        viewer.ImageMap = layer.getHTMLImageMap("clickable", "", _
            "title='Concentration on {label}: {value} ppm'")

    End Sub

End Class
[WPF - C#] NetWPFCharts\CSharpWPFCharts\polarzones2.cs
using System;
using ChartDirector;

namespace CSharpWPFCharts
{
    public class polarzones2 : DemoModule
    {
        //Name of demo module
        public string getName() { return "Sector Zones"; }

        //Number of charts produced in this demo module
        public int getNoOfCharts() { return 1; }

        //Main code for creating chart.
        //Note: the argument chartIndex is unused because this demo only has 1 chart.
        public void createChart(WPFChartViewer viewer, int chartIndex)
        {
            // The data for the chart
            double[] data = {5.1, 1.5, 5.1, 4.0, 1.7, 8.7, 9.4, 2.1, 3.5, 8.8, 5.0, 6.0};

            // The labels for the chart
            string[] labels = {"Jan", "Feb", "Mar", "Apr", "May", "Jun", "Jul", "Aug", "Sept",
                "Oct", "Nov", "Dec"};

            // Create a PolarChart object of size 400 x 420 pixels. with a metallic blue (9999ff)
            // background color and 1 pixel 3D border
            PolarChart c = new PolarChart(400, 420, Chart.metalColor(0x9999ff), 0x000000, 1);

            // Add a title to the chart using 16pt Arial Bold Italic font. The title text is white
            // (0xffffff) on deep blue (000080) background
            c.addTitle("Chemical Concentration", "Arial Bold Italic", 16, 0xffffff).setBackground(
                0x000080);

            // Set center of plot area at (200, 240) with radius 145 pixels. Set background color to
            // green (0x33ff33)
            c.setPlotArea(200, 240, 145, 0x33ff33);

            // Set the labels to the angular axis
            c.angularAxis().setLabels(labels);

            // Color the sector between label index = 5.5 to 7.5 as red (ff3333) zone
            c.angularAxis().addZone(5.5, 7.5, 0xff3333);

            // Color the sector between label index = 4.5 to 5.5, and also between 7.5 to 8.5, as
            // yellow (ff3333) zones
            c.angularAxis().addZone(4.5, 5.5, 0xffff00);
            c.angularAxis().addZone(7.5, 8.5, 0xffff00);

            // Set the grid style to circular grid
            c.setGridStyle(false);

            // Use semi-transparent (40ffffff) label background so as not to block the data
            c.radialAxis().setLabelStyle().setBackground(0x40ffffff, 0x40000000);

            // Add a legend box at (200, 30) top center aligned, using 9pt Arial Bold font. with a
            // black border.
            LegendBox legendBox = c.addLegend(200, 30, false, "Arial Bold", 9);
            legendBox.setAlignment(Chart.TopCenter);

            // Add legend keys to represent the red/yellow/green zones
            legendBox.addKey("Very Dry", 0xff3333);
            legendBox.addKey("Critical", 0xffff00);
            legendBox.addKey("Moderate", 0x33ff33);

            // Add a blue (0x80) line layer with line width set to 3 pixels and use purple (ff00ff)
            // cross symbols for the data points
            PolarLineLayer layer = c.addLineLayer(data, 0x000080);
            layer.setLineWidth(3);
            layer.setDataSymbol(Chart.Cross2Shape(), 15, 0xff00ff);

            // Output the chart
            viewer.Chart = c;

            // Include tool tip for the chart.
            viewer.ImageMap = layer.getHTMLImageMap("clickable", "",
                "title='Concentration on {label}: {value} ppm'");
        }
    }
}
[ASP.NET Web Forms - C# version] NetWebCharts\CSharpASP\polarzones2.aspx
(Click here on how to convert this code to code-behind style.)<%@ Page Language="C#" Debug="true" %>
<%@ Import Namespace="ChartDirector" %>
<%@ Register TagPrefix="chart" Namespace="ChartDirector" Assembly="netchartdir" %>
<!DOCTYPE html>
<script runat="server">
//
// Page Load event handler
//
protected void Page_Load(object sender, EventArgs e)
{
// The data for the chart
double[] data = {5.1, 1.5, 5.1, 4.0, 1.7, 8.7, 9.4, 2.1, 3.5, 8.8, 5.0, 6.0};
// The labels for the chart
string[] labels = {"Jan", "Feb", "Mar", "Apr", "May", "Jun", "Jul", "Aug", "Sept", "Oct", "Nov",
"Dec"};
// Create a PolarChart object of size 400 x 420 pixels. with a metallic blue (9999ff) background
// color and 1 pixel 3D border
PolarChart c = new PolarChart(400, 420, Chart.metalColor(0x9999ff), 0x000000, 1);
// Add a title to the chart using 16pt Arial Bold Italic font. The title text is white
// (0xffffff) on deep blue (000080) background
c.addTitle("Chemical Concentration", "Arial Bold Italic", 16, 0xffffff).setBackground(0x000080);
// Set center of plot area at (200, 240) with radius 145 pixels. Set background color to green
// (0x33ff33)
c.setPlotArea(200, 240, 145, 0x33ff33);
// Set the labels to the angular axis
c.angularAxis().setLabels(labels);
// Color the sector between label index = 5.5 to 7.5 as red (ff3333) zone
c.angularAxis().addZone(5.5, 7.5, 0xff3333);
// Color the sector between label index = 4.5 to 5.5, and also between 7.5 to 8.5, as yellow
// (ff3333) zones
c.angularAxis().addZone(4.5, 5.5, 0xffff00);
c.angularAxis().addZone(7.5, 8.5, 0xffff00);
// Set the grid style to circular grid
c.setGridStyle(false);
// Use semi-transparent (40ffffff) label background so as not to block the data
c.radialAxis().setLabelStyle().setBackground(0x40ffffff, 0x40000000);
// Add a legend box at (200, 30) top center aligned, using 9pt Arial Bold font. with a black
// border.
LegendBox legendBox = c.addLegend(200, 30, false, "Arial Bold", 9);
legendBox.setAlignment(Chart.TopCenter);
// Add legend keys to represent the red/yellow/green zones
legendBox.addKey("Very Dry", 0xff3333);
legendBox.addKey("Critical", 0xffff00);
legendBox.addKey("Moderate", 0x33ff33);
// Add a blue (0x80) line layer with line width set to 3 pixels and use purple (ff00ff) cross
// symbols for the data points
PolarLineLayer layer = c.addLineLayer(data, 0x000080);
layer.setLineWidth(3);
layer.setDataSymbol(Chart.Cross2Shape(), 15, 0xff00ff);
// Output the chart
WebChartViewer1.Image = c.makeWebImage(Chart.SVG);
// Include tool tip for the chart.
WebChartViewer1.ImageMap = layer.getHTMLImageMap("", "",
"title='Concentration on {label}: {value} ppm'");
}
</script>
<html>
<head>
<script type="text/javascript" src="cdjcv.js"></script>
</head>
<body>
<chart:WebChartViewer id="WebChartViewer1" runat="server" />
</body>
</html>
[ASP.NET Web Forms - VB Version] NetWebCharts\VBNetASP\polarzones2.aspx
(Click here on how to convert this code to code-behind style.)<%@ Page Language="VB" Debug="true" %>
<%@ Import Namespace="ChartDirector" %>
<%@ Register TagPrefix="chart" Namespace="ChartDirector" Assembly="netchartdir" %>
<!DOCTYPE html>
<script runat="server">
'
' Page Load event handler
'
Protected Sub Page_Load(ByVal sender As System.Object, ByVal e As System.EventArgs)
' The data for the chart
Dim data() As Double = {5.1, 1.5, 5.1, 4.0, 1.7, 8.7, 9.4, 2.1, 3.5, 8.8, 5.0, 6.0}
' The labels for the chart
Dim labels() As String = {"Jan", "Feb", "Mar", "Apr", "May", "Jun", "Jul", "Aug", "Sept", _
"Oct", "Nov", "Dec"}
' Create a PolarChart object of size 400 x 420 pixels. with a metallic blue (9999ff) background
' color and 1 pixel 3D border
Dim c As PolarChart = New PolarChart(400, 420, Chart.metalColor(&H9999ff), &H000000, 1)
' Add a title to the chart using 16pt Arial Bold Italic font. The title text is white (0xffffff)
' on deep blue (000080) background
c.addTitle("Chemical Concentration", "Arial Bold Italic", 16, &Hffffff).setBackground(&H000080)
' Set center of plot area at (200, 240) with radius 145 pixels. Set background color to green
' (0x33ff33)
c.setPlotArea(200, 240, 145, &H33ff33)
' Set the labels to the angular axis
c.angularAxis().setLabels(labels)
' Color the sector between label index = 5.5 to 7.5 as red (ff3333) zone
c.angularAxis().addZone(5.5, 7.5, &Hff3333)
' Color the sector between label index = 4.5 to 5.5, and also between 7.5 to 8.5, as yellow
' (ff3333) zones
c.angularAxis().addZone(4.5, 5.5, &Hffff00)
c.angularAxis().addZone(7.5, 8.5, &Hffff00)
' Set the grid style to circular grid
c.setGridStyle(False)
' Use semi-transparent (40ffffff) label background so as not to block the data
c.radialAxis().setLabelStyle().setBackground(&H40ffffff, &H40000000)
' Add a legend box at (200, 30) top center aligned, using 9pt Arial Bold font. with a black
' border.
Dim legendBox As LegendBox = c.addLegend(200, 30, False, "Arial Bold", 9)
legendBox.setAlignment(Chart.TopCenter)
' Add legend keys to represent the red/yellow/green zones
legendBox.addKey("Very Dry", &Hff3333)
legendBox.addKey("Critical", &Hffff00)
legendBox.addKey("Moderate", &H33ff33)
' Add a blue (0x80) line layer with line width set to 3 pixels and use purple (ff00ff) cross
' symbols for the data points
Dim layer As PolarLineLayer = c.addLineLayer(data, &H000080)
layer.setLineWidth(3)
layer.setDataSymbol(Chart.Cross2Shape(), 15, &Hff00ff)
' Output the chart
WebChartViewer1.Image = c.makeWebImage(Chart.SVG)
' Include tool tip for the chart.
WebChartViewer1.ImageMap = layer.getHTMLImageMap("", "", _
"title='Concentration on {label}: {value} ppm'")
End Sub
</script>
<html>
<head>
<script type="text/javascript" src="cdjcv.js"></script>
</head>
<body>
<chart:WebChartViewer id="WebChartViewer1" runat="server" />
</body>
</html>
[ASP.NET MVC - Controller] NetMvcCharts\Controllers\Polarzones2Controller.cs
using System;
using System.Web.Mvc;
using ChartDirector;

namespace NetMvcCharts.Controllers
{
    public class Polarzones2Controller : Controller
    {
        //
        // Default Action
        //
        public ActionResult Index()
        {
            ViewBag.Title = "Sector Zones";
            createChart(ViewBag.Viewer = new RazorChartViewer(HttpContext, "chart1"));
            return View("~/Views/Shared/ChartView.cshtml");
        }

        //
        // Create chart
        //
        private void createChart(RazorChartViewer viewer)
        {
            // The data for the chart
            double[] data = {5.1, 1.5, 5.1, 4.0, 1.7, 8.7, 9.4, 2.1, 3.5, 8.8, 5.0, 6.0};

            // The labels for the chart
            string[] labels = {"Jan", "Feb", "Mar", "Apr", "May", "Jun", "Jul", "Aug", "Sept", "Oct",
                "Nov", "Dec"};

            // Create a PolarChart object of size 400 x 420 pixels. with a metallic blue (9999ff)
            // background color and 1 pixel 3D border
            PolarChart c = new PolarChart(400, 420, Chart.metalColor(0x9999ff), 0x000000, 1);

            // Add a title to the chart using 16pt Arial Bold Italic font. The title text is white
            // (0xffffff) on deep blue (000080) background
            c.addTitle("Chemical Concentration", "Arial Bold Italic", 16, 0xffffff).setBackground(
                0x000080);

            // Set center of plot area at (200, 240) with radius 145 pixels. Set background color to
            // green (0x33ff33)
            c.setPlotArea(200, 240, 145, 0x33ff33);

            // Set the labels to the angular axis
            c.angularAxis().setLabels(labels);

            // Color the sector between label index = 5.5 to 7.5 as red (ff3333) zone
            c.angularAxis().addZone(5.5, 7.5, 0xff3333);

            // Color the sector between label index = 4.5 to 5.5, and also between 7.5 to 8.5, as yellow
            // (ff3333) zones
            c.angularAxis().addZone(4.5, 5.5, 0xffff00);
            c.angularAxis().addZone(7.5, 8.5, 0xffff00);

            // Set the grid style to circular grid
            c.setGridStyle(false);

            // Use semi-transparent (40ffffff) label background so as not to block the data
            c.radialAxis().setLabelStyle().setBackground(0x40ffffff, 0x40000000);

            // Add a legend box at (200, 30) top center aligned, using 9pt Arial Bold font. with a black
            // border.
            LegendBox legendBox = c.addLegend(200, 30, false, "Arial Bold", 9);
            legendBox.setAlignment(Chart.TopCenter);

            // Add legend keys to represent the red/yellow/green zones
            legendBox.addKey("Very Dry", 0xff3333);
            legendBox.addKey("Critical", 0xffff00);
            legendBox.addKey("Moderate", 0x33ff33);

            // Add a blue (0x80) line layer with line width set to 3 pixels and use purple (ff00ff) cross
            // symbols for the data points
            PolarLineLayer layer = c.addLineLayer(data, 0x000080);
            layer.setLineWidth(3);
            layer.setDataSymbol(Chart.Cross2Shape(), 15, 0xff00ff);

            // Output the chart
            viewer.Image = c.makeWebImage(Chart.SVG);

            // Include tool tip for the chart.
            viewer.ImageMap = layer.getHTMLImageMap("", "",
                "title='Concentration on {label}: {value} ppm'");
        }
    }
}
[ASP.NET MVC - View] NetMvcCharts\Views\Shared\ChartView.cshtml
@{ Layout = null; }

<!DOCTYPE html>

<html>
<head>
    <meta name="viewport" content="width=device-width" />
    <title>@ViewBag.Title</title>
    <style>
        @ViewBag.Style
    </style>
    @Scripts.Render("~/Scripts/cdjcv.js")
</head>
<body style="margin:5px 0px 0px 5px">
    <div style="font:bold 18pt verdana;">
        @ViewBag.Title
    </div>
    <hr style="border:solid 1px #000080; background:#000080" />
    <div>
        @{
            if (ViewBag.Viewer is Array)
            {
                // Display multiple charts
                for (int i = 0; i < ViewBag.Viewer.Length; ++i)
                {
                    @:@Html.Raw(ViewBag.Viewer[i].RenderHTML())
                }
            }
            else
            {
                // Display one chart only
                @:@Html.Raw(ViewBag.Viewer.RenderHTML())
            }
        }
    </div>
</body>
</html>
© 2023 Advanced Software Engineering Limited. All rights reserved.