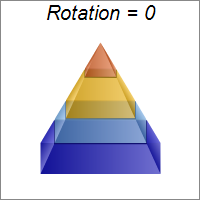
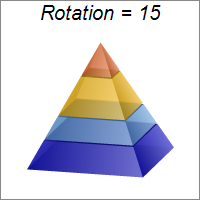
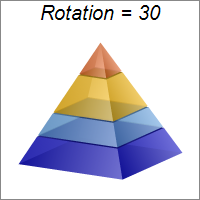
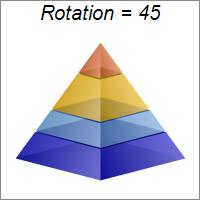
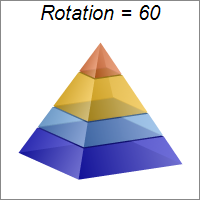
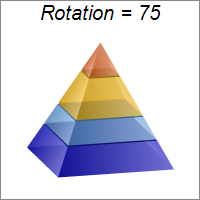
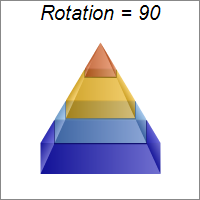
This example demonstrates viewing the pyramid at different rotation angles, configured with PyramidChart.setViewAngle.
ChartDirector 7.1 (.NET Edition)
Pyramid Rotation
Source Code Listing
using System;
using ChartDirector;

namespace CSharpChartExplorer
{
    public class pyramidrotation : DemoModule
    {
        //Name of demo module
        public string getName() { return "Pyramid Rotation"; }

        //Number of charts produced in this demo module
        public int getNoOfCharts() { return 7; }

        //Main code for creating charts
        public void createChart(WinChartViewer viewer, int chartIndex)
        {
            // The data for the pyramid chart
            double[] data = {156, 123, 211, 179};

            // The semi-transparent colors for the pyramid layers
            int[] colors = {0x400000cc, 0x4066aaee, 0x40ffbb00, 0x40ee6622};

            // The rotation angle
            int angle = chartIndex * 15;

            // Create a PyramidChart object of size 200 x 200 pixels, with white (ffffff) background
            // and grey (888888) border
            PyramidChart c = new PyramidChart(200, 200, 0xffffff, 0x888888);

            // Set the pyramid center at (100, 100), and width x height to 60 x 120 pixels
            c.setPyramidSize(100, 100, 60, 120);

            // Set the elevation to 15 degrees and use the given rotation angle
            c.addTitle("Rotation = " + angle, "Arial Italic", 15);
            c.setViewAngle(15, angle);

            // Set the pyramid data
            c.setData(data);

            // Set the layer colors to the given colors
            c.setColors2(Chart.DataColor, colors);

            // Leave 1% gaps between layers
            c.setLayerGap(0.01);

            // Output the chart
            viewer.Chart = c;
        }
    }
}Imports System
Imports Microsoft.VisualBasic
Imports ChartDirector
Public Class pyramidrotation
Implements DemoModule
'Name of demo module
Public Function getName() As String Implements DemoModule.getName
Return "Pyramid Rotation"
End Function
'Number of charts produced in this demo module
Public Function getNoOfCharts() As Integer Implements DemoModule.getNoOfCharts
Return 7
End Function
'Main code for creating charts
Public Sub createChart(viewer As WinChartViewer, chartIndex As Integer) _
Implements DemoModule.createChart
' The data for the pyramid chart
Dim data() As Double = {156, 123, 211, 179}
' The semi-transparent colors for the pyramid layers
Dim colors() As Integer = {&H400000cc, &H4066aaee, &H40ffbb00, &H40ee6622}
' The rotation angle
Dim angle As Integer = chartIndex * 15
' Create a PyramidChart object of size 200 x 200 pixels, with white (ffffff) background and
' grey (888888) border
Dim c As PyramidChart = New PyramidChart(200, 200, &Hffffff, &H888888)
' Set the pyramid center at (100, 100), and width x height to 60 x 120 pixels
c.setPyramidSize(100, 100, 60, 120)
' Set the elevation to 15 degrees and use the given rotation angle
c.addTitle("Rotation = " & angle, "Arial Italic", 15)
c.setViewAngle(15, angle)
' Set the pyramid data
c.setData(data)
' Set the layer colors to the given colors
c.setColors2(Chart.DataColor, colors)
' Leave 1% gaps between layers
c.setLayerGap(0.01)
' Output the chart
viewer.Chart = c
End Sub
End Classusing System;
using ChartDirector;
namespace CSharpWPFCharts
{
public class pyramidrotation : DemoModule
{
//Name of demo module
public string getName() { return "Pyramid Rotation"; }
//Number of charts produced in this demo module
public int getNoOfCharts() { return 7; }
//Main code for creating charts
public void createChart(WPFChartViewer viewer, int chartIndex)
{
// The data for the pyramid chart
double[] data = {156, 123, 211, 179};
// The semi-transparent colors for the pyramid layers
int[] colors = {0x400000cc, 0x4066aaee, 0x40ffbb00, 0x40ee6622};
// The rotation angle
int angle = chartIndex * 15;
// Create a PyramidChart object of size 200 x 200 pixels, with white (ffffff) background
// and grey (888888) border
PyramidChart c = new PyramidChart(200, 200, 0xffffff, 0x888888);
// Set the pyramid center at (100, 100), and width x height to 60 x 120 pixels
c.setPyramidSize(100, 100, 60, 120);
// Set the elevation to 15 degrees and use the given rotation angle
c.addTitle("Rotation = " + angle, "Arial Italic", 15);
c.setViewAngle(15, angle);
// Set the pyramid data
c.setData(data);
// Set the layer colors to the given colors
c.setColors2(Chart.DataColor, colors);
// Leave 1% gaps between layers
c.setLayerGap(0.01);
// Output the chart
viewer.Chart = c;
}
}
}<%@ Page Language="C#" Debug="true" %>
<%@ Import Namespace="ChartDirector" %>
<%@ Register TagPrefix="chart" Namespace="ChartDirector" Assembly="netchartdir" %>
<!DOCTYPE html>
<script runat="server">
//
// Create chart
//
protected void createChart(WebChartViewer viewer, int chartIndex)
{
// The data for the pyramid chart
double[] data = {156, 123, 211, 179};
// The semi-transparent colors for the pyramid layers
int[] colors = {0x400000cc, 0x4066aaee, 0x40ffbb00, 0x40ee6622};
// The rotation angle
int angle = chartIndex * 15;
// Create a PyramidChart object of size 200 x 200 pixels, with white (ffffff) background and
// grey (888888) border
PyramidChart c = new PyramidChart(200, 200, 0xffffff, 0x888888);
// Set the pyramid center at (100, 100), and width x height to 60 x 120 pixels
c.setPyramidSize(100, 100, 60, 120);
// Set the elevation to 15 degrees and use the given rotation angle
c.addTitle("Rotation = " + angle, "Arial Italic", 15);
c.setViewAngle(15, angle);
// Set the pyramid data
c.setData(data);
// Set the layer colors to the given colors
c.setColors2(Chart.DataColor, colors);
// Leave 1% gaps between layers
c.setLayerGap(0.01);
// Output the chart
viewer.Image = c.makeWebImage(Chart.SVG);
}
//
// Page Load event handler
//
protected void Page_Load(object sender, EventArgs e)
{
createChart(WebChartViewer0, 0);
createChart(WebChartViewer1, 1);
createChart(WebChartViewer2, 2);
createChart(WebChartViewer3, 3);
createChart(WebChartViewer4, 4);
createChart(WebChartViewer5, 5);
createChart(WebChartViewer6, 6);
}
</script>
<html>
<head>
<script type="text/javascript" src="cdjcv.js"></script>
</head>
<body>
<chart:WebChartViewer id="WebChartViewer0" runat="server" />
<chart:WebChartViewer id="WebChartViewer1" runat="server" />
<chart:WebChartViewer id="WebChartViewer2" runat="server" />
<chart:WebChartViewer id="WebChartViewer3" runat="server" />
<chart:WebChartViewer id="WebChartViewer4" runat="server" />
<chart:WebChartViewer id="WebChartViewer5" runat="server" />
<chart:WebChartViewer id="WebChartViewer6" runat="server" />
</body>
</html><%@ Page Language="VB" Debug="true" %>
<%@ Import Namespace="ChartDirector" %>
<%@ Register TagPrefix="chart" Namespace="ChartDirector" Assembly="netchartdir" %>
<!DOCTYPE html>
<script runat="server">
'
' Create chart
'
Protected Sub createChart(viewer As WebChartViewer, chartIndex As Integer)
' The data for the pyramid chart
Dim data() As Double = {156, 123, 211, 179}
' The semi-transparent colors for the pyramid layers
Dim colors() As Integer = {&H400000cc, &H4066aaee, &H40ffbb00, &H40ee6622}
' The rotation angle
Dim angle As Integer = chartIndex * 15
' Create a PyramidChart object of size 200 x 200 pixels, with white (ffffff) background and grey
' (888888) border
Dim c As PyramidChart = New PyramidChart(200, 200, &Hffffff, &H888888)
' Set the pyramid center at (100, 100), and width x height to 60 x 120 pixels
c.setPyramidSize(100, 100, 60, 120)
' Set the elevation to 15 degrees and use the given rotation angle
c.addTitle("Rotation = " & angle, "Arial Italic", 15)
c.setViewAngle(15, angle)
' Set the pyramid data
c.setData(data)
' Set the layer colors to the given colors
c.setColors2(Chart.DataColor, colors)
' Leave 1% gaps between layers
c.setLayerGap(0.01)
' Output the chart
viewer.Image = c.makeWebImage(Chart.SVG)
End Sub
'
' Page Load event handler
'
Protected Sub Page_Load(ByVal sender As System.Object, ByVal e As System.EventArgs)
createChart(WebChartViewer0, 0)
createChart(WebChartViewer1, 1)
createChart(WebChartViewer2, 2)
createChart(WebChartViewer3, 3)
createChart(WebChartViewer4, 4)
createChart(WebChartViewer5, 5)
createChart(WebChartViewer6, 6)
End Sub
</script>
<html>
<head>
<script type="text/javascript" src="cdjcv.js"></script>
</head>
<body>
<chart:WebChartViewer id="WebChartViewer0" runat="server" />
<chart:WebChartViewer id="WebChartViewer1" runat="server" />
<chart:WebChartViewer id="WebChartViewer2" runat="server" />
<chart:WebChartViewer id="WebChartViewer3" runat="server" />
<chart:WebChartViewer id="WebChartViewer4" runat="server" />
<chart:WebChartViewer id="WebChartViewer5" runat="server" />
<chart:WebChartViewer id="WebChartViewer6" runat="server" />
</body>
</html>using System;
using System.Web.Mvc;
using ChartDirector;
namespace NetMvcCharts.Controllers
{
public class PyramidrotationController : Controller
{
//
// Default Action
//
public ActionResult Index()
{
ViewBag.Title = "Pyramid Rotation";
// This example contains 7 charts.
ViewBag.Viewer = new RazorChartViewer[7];
for (int i = 0; i < ViewBag.Viewer.Length; ++i)
createChart(ViewBag.Viewer[i] = new RazorChartViewer(HttpContext, "chart" + i), i);
return View("~/Views/Shared/ChartView.cshtml");
}
//
// Create chart
//
private void createChart(RazorChartViewer viewer, int chartIndex)
{
// The data for the pyramid chart
double[] data = {156, 123, 211, 179};
// The semi-transparent colors for the pyramid layers
int[] colors = {0x400000cc, 0x4066aaee, 0x40ffbb00, 0x40ee6622};
// The rotation angle
int angle = chartIndex * 15;
// Create a PyramidChart object of size 200 x 200 pixels, with white (ffffff) background and
// grey (888888) border
PyramidChart c = new PyramidChart(200, 200, 0xffffff, 0x888888);
// Set the pyramid center at (100, 100), and width x height to 60 x 120 pixels
c.setPyramidSize(100, 100, 60, 120);
// Set the elevation to 15 degrees and use the given rotation angle
c.addTitle("Rotation = " + angle, "Arial Italic", 15);
c.setViewAngle(15, angle);
// Set the pyramid data
c.setData(data);
// Set the layer colors to the given colors
c.setColors2(Chart.DataColor, colors);
// Leave 1% gaps between layers
c.setLayerGap(0.01);
// Output the chart
viewer.Image = c.makeWebImage(Chart.SVG);
}
}
}@{ Layout = null; }
<!DOCTYPE html>
<html>
<head>
<meta name="viewport" content="width=device-width" />
<title>@ViewBag.Title</title>
<style>
@ViewBag.Style
</style>
@Scripts.Render("~/Scripts/cdjcv.js")
</head>
<body style="margin:5px 0px 0px 5px">
<div style="font:bold 18pt verdana;">
@ViewBag.Title
</div>
<hr style="border:solid 1px #000080; background:#000080" />
<div>
@{
if (ViewBag.Viewer is Array)
{
// Display multiple charts
for (int i = 0; i < ViewBag.Viewer.Length; ++i)
{
@:@Html.Raw(ViewBag.Viewer[i].RenderHTML())
}
}
else
{
// Display one chart only
@:@Html.Raw(ViewBag.Viewer.RenderHTML())
}
}
</div>
</body>
</html>