[Windows Forms - C# version] NetWinCharts\CSharpWinCharts\rotatedline.cs
using System;
using ChartDirector;
namespace CSharpChartExplorer
{
public class rotatedline : DemoModule
{
//Name of demo module
public string getName() { return "Rotated Line Chart"; }
//Number of charts produced in this demo module
public int getNoOfCharts() { return 1; }
//Main code for creating chart.
//Note: the argument chartIndex is unused because this demo only has 1 chart.
public void createChart(WinChartViewer viewer, int chartIndex)
{
//
// We use a random table to simulate generating 12 months of data
//
// Create the random table object with 4 cols * 12 rows, using 3 as seed
RanTable rantable = new RanTable(3, 4, 12);
// Set the 1st column to be the 12 months of year 2002
rantable.setDateCol(0, new DateTime(2002, 1, 1), 86400 * 30);
// Set the 2nd, 3rd and 4th columns to be random numbers starting from 125, 75, and 100
// respectively. The change between rows is set to -35 to + 35. The minimum value of any
// cell is 0.
rantable.setCol(1, 125, -35, 35, 0);
rantable.setCol(2, 75, -35, 35, 0);
rantable.setCol(3, 100, -35, 35, 0);
// Get the 1st column (time) as the x data
double[] dataX = rantable.getCol(0);
// Get the 2nd, 3rd and 4th columns as 3 data sets
double[] dataY0 = rantable.getCol(1);
double[] dataY1 = rantable.getCol(2);
double[] dataY2 = rantable.getCol(3);
// Create a XYChart object of size 360 x 400 pixels
XYChart c = new XYChart(360, 400);
// Add a title to the chart
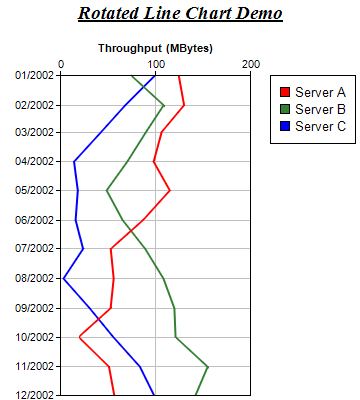
c.addTitle("<*underline=2*>Rotated Line Chart Demo", "Times New Roman Bold Italic", 14);
// Set the plotarea at (60, 75) and of size 190 x 320 pixels. Turn on both horizontal
// and vertical grid lines with light grey color (0xc0c0c0)
c.setPlotArea(60, 75, 190, 320).setGridColor(0xc0c0c0, 0xc0c0c0);
// Add a legend box at (270, 75)
c.addLegend(270, 75);
// Swap the x and y axis to become a rotated chart
c.swapXY();
// Set the y axis on the top side (right + rotated = top)
c.setYAxisOnRight();
// Add a title to the y axis
c.yAxis().setTitle("Throughput (MBytes)");
// Reverse the x axis so it is pointing downwards
c.xAxis().setReverse();
// Add a line chart layer using the given data
LineLayer layer = c.addLineLayer2();
layer.setXData(dataX);
layer.addDataSet(dataY0, 0xff0000, "Server A");
layer.addDataSet(dataY1, 0x338033, "Server B");
layer.addDataSet(dataY2, 0x0000ff, "Server C");
// Set the line width to 2 pixels
layer.setLineWidth(2);
// Output the chart
viewer.Chart = c;
//include tool tip for the chart
viewer.ImageMap = c.getHTMLImageMap("clickable", "",
"title='[{dataSetName}] {x|mm/yyyy}: {value|0} MByte'");
}
}
}
[Windows Forms - VB Version] NetWinCharts\VBNetWinCharts\rotatedline.vb
Imports System
Imports Microsoft.VisualBasic
Imports ChartDirector

Public Class rotatedline
    Implements DemoModule

    'Name of demo module
    Public Function getName() As String Implements DemoModule.getName
        Return "Rotated Line Chart"
    End Function

    'Number of charts produced in this demo module
    Public Function getNoOfCharts() As Integer Implements DemoModule.getNoOfCharts
        Return 1
    End Function

    'Main code for creating chart.
    'Note: the argument chartIndex is unused because this demo only has 1 chart.
    Public Sub createChart(viewer As WinChartViewer, chartIndex As Integer) _
        Implements DemoModule.createChart

        '
        '    We use a random table to simulate generating 12 months of data
        '

        ' Create the random table object with 4 cols * 12 rows, using 3 as seed
        Dim rantable As RanTable = New RanTable(3, 4, 12)

        ' Set the 1st column to be the 12 months of year 2002
        rantable.setDateCol(0, DateSerial(2002, 1, 1), 86400 * 30)

        ' Set the 2nd, 3rd and 4th columns to be random numbers starting from 125, 75, and 100
        ' respectively. The change between rows is set to -35 to + 35. The minimum value of any cell
        ' is 0.
        rantable.setCol(1, 125, -35, 35, 0)
        rantable.setCol(2, 75, -35, 35, 0)
        rantable.setCol(3, 100, -35, 35, 0)

        ' Get the 1st column (time) as the x data
        Dim dataX() As Double = rantable.getCol(0)

        ' Get the 2nd, 3rd and 4th columns as 3 data sets
        Dim dataY0() As Double = rantable.getCol(1)
        Dim dataY1() As Double = rantable.getCol(2)
        Dim dataY2() As Double = rantable.getCol(3)

        ' Create a XYChart object of size 360 x 400 pixels
        Dim c As XYChart = New XYChart(360, 400)

        ' Add a title to the chart
        c.addTitle("<*underline=2*>Rotated Line Chart Demo", "Times New Roman Bold Italic", 14)

        ' Set the plotarea at (60, 75) and of size 190 x 320 pixels. Turn on both horizontal and
        ' vertical grid lines with light grey color (0xc0c0c0)
        c.setPlotArea(60, 75, 190, 320).setGridColor(&Hc0c0c0, &Hc0c0c0)

        ' Add a legend box at (270, 75)
        c.addLegend(270, 75)

        ' Swap the x and y axis to become a rotated chart
        c.swapXY()

        ' Set the y axis on the top side (right + rotated = top)
        c.setYAxisOnRight()

        ' Add a title to the y axis
        c.yAxis().setTitle("Throughput (MBytes)")

        ' Reverse the x axis so it is pointing downwards
        c.xAxis().setReverse()

        ' Add a line chart layer using the given data
        Dim layer As LineLayer = c.addLineLayer2()
        layer.setXData(dataX)
        layer.addDataSet(dataY0, &Hff0000, "Server A")
        layer.addDataSet(dataY1, &H338033, "Server B")
        layer.addDataSet(dataY2, &H0000ff, "Server C")

        ' Set the line width to 2 pixels
        layer.setLineWidth(2)

        ' Output the chart
        viewer.Chart = c

        'include tool tip for the chart
        viewer.ImageMap = c.getHTMLImageMap("clickable", "", _
            "title='[{dataSetName}] {x|mm/yyyy}: {value|0} MByte'")

    End Sub

End Class
[WPF - C#] NetWPFCharts\CSharpWPFCharts\rotatedline.cs
using System;
using ChartDirector;

namespace CSharpWPFCharts
{
    public class rotatedline : DemoModule
    {
        //Name of demo module
        public string getName() { return "Rotated Line Chart"; }

        //Number of charts produced in this demo module
        public int getNoOfCharts() { return 1; }

        //Main code for creating chart.
        //Note: the argument chartIndex is unused because this demo only has 1 chart.
        public void createChart(WPFChartViewer viewer, int chartIndex)
        {
            //
            //    We use a random table to simulate generating 12 months of data
            //

            // Create the random table object with 4 cols * 12 rows, using 3 as seed
            RanTable rantable = new RanTable(3, 4, 12);

            // Set the 1st column to be the 12 months of year 2002
            rantable.setDateCol(0, new DateTime(2002, 1, 1), 86400 * 30);

            // Set the 2nd, 3rd and 4th columns to be random numbers starting from 125, 75, and 100
            // respectively. The change between rows is set to -35 to + 35. The minimum value of any
            // cell is 0.
            rantable.setCol(1, 125, -35, 35, 0);
            rantable.setCol(2, 75, -35, 35, 0);
            rantable.setCol(3, 100, -35, 35, 0);

            // Get the 1st column (time) as the x data
            double[] dataX = rantable.getCol(0);

            // Get the 2nd, 3rd and 4th columns as 3 data sets
            double[] dataY0 = rantable.getCol(1);
            double[] dataY1 = rantable.getCol(2);
            double[] dataY2 = rantable.getCol(3);

            // Create a XYChart object of size 360 x 400 pixels
            XYChart c = new XYChart(360, 400);

            // Add a title to the chart
            c.addTitle("<*underline=2*>Rotated Line Chart Demo", "Times New Roman Bold Italic", 14);

            // Set the plotarea at (60, 75) and of size 190 x 320 pixels. Turn on both horizontal
            // and vertical grid lines with light grey color (0xc0c0c0)
            c.setPlotArea(60, 75, 190, 320).setGridColor(0xc0c0c0, 0xc0c0c0);

            // Add a legend box at (270, 75)
            c.addLegend(270, 75);

            // Swap the x and y axis to become a rotated chart
            c.swapXY();

            // Set the y axis on the top side (right + rotated = top)
            c.setYAxisOnRight();

            // Add a title to the y axis
            c.yAxis().setTitle("Throughput (MBytes)");

            // Reverse the x axis so it is pointing downwards
            c.xAxis().setReverse();

            // Add a line chart layer using the given data
            LineLayer layer = c.addLineLayer2();
            layer.setXData(dataX);
            layer.addDataSet(dataY0, 0xff0000, "Server A");
            layer.addDataSet(dataY1, 0x338033, "Server B");
            layer.addDataSet(dataY2, 0x0000ff, "Server C");

            // Set the line width to 2 pixels
            layer.setLineWidth(2);

            // Output the chart
            viewer.Chart = c;

            //include tool tip for the chart
            viewer.ImageMap = c.getHTMLImageMap("clickable", "",
                "title='[{dataSetName}] {x|mm/yyyy}: {value|0} MByte'");
        }
    }
}
[ASP.NET Web Forms - C# version] NetWebCharts\CSharpASP\rotatedline.aspx
(Click here on how to convert this code to code-behind style.)<%@ Page Language="C#" Debug="true" %>
<%@ Import Namespace="ChartDirector" %>
<%@ Register TagPrefix="chart" Namespace="ChartDirector" Assembly="netchartdir" %>
<!DOCTYPE html>
<script runat="server">
//
// Page Load event handler
//
protected void Page_Load(object sender, EventArgs e)
{
//
// We use a random table to simulate generating 12 months of data
//
// Create the random table object with 4 cols * 12 rows, using 3 as seed
RanTable rantable = new RanTable(3, 4, 12);
// Set the 1st column to be the 12 months of year 2002
rantable.setDateCol(0, new DateTime(2002, 1, 1), 86400 * 30);
// Set the 2nd, 3rd and 4th columns to be random numbers starting from 125, 75, and 100
// respectively. The change between rows is set to -35 to + 35. The minimum value of any cell is
// 0.
rantable.setCol(1, 125, -35, 35, 0);
rantable.setCol(2, 75, -35, 35, 0);
rantable.setCol(3, 100, -35, 35, 0);
// Get the 1st column (time) as the x data
double[] dataX = rantable.getCol(0);
// Get the 2nd, 3rd and 4th columns as 3 data sets
double[] dataY0 = rantable.getCol(1);
double[] dataY1 = rantable.getCol(2);
double[] dataY2 = rantable.getCol(3);
// Create a XYChart object of size 360 x 400 pixels
XYChart c = new XYChart(360, 400);
// Add a title to the chart
c.addTitle("<*underline=2*>Rotated Line Chart Demo", "Times New Roman Bold Italic", 14);
// Set the plotarea at (60, 75) and of size 190 x 320 pixels. Turn on both horizontal and
// vertical grid lines with light grey color (0xc0c0c0)
c.setPlotArea(60, 75, 190, 320).setGridColor(0xc0c0c0, 0xc0c0c0);
// Add a legend box at (270, 75)
c.addLegend(270, 75);
// Swap the x and y axis to become a rotated chart
c.swapXY();
// Set the y axis on the top side (right + rotated = top)
c.setYAxisOnRight();
// Add a title to the y axis
c.yAxis().setTitle("Throughput (MBytes)");
// Reverse the x axis so it is pointing downwards
c.xAxis().setReverse();
// Add a line chart layer using the given data
LineLayer layer = c.addLineLayer2();
layer.setXData(dataX);
layer.addDataSet(dataY0, 0xff0000, "Server A");
layer.addDataSet(dataY1, 0x338033, "Server B");
layer.addDataSet(dataY2, 0x0000ff, "Server C");
// Set the line width to 2 pixels
layer.setLineWidth(2);
// Output the chart
WebChartViewer1.Image = c.makeWebImage(Chart.SVG);
// Include tool tip for the chart
WebChartViewer1.ImageMap = c.getHTMLImageMap("", "",
"title='[{dataSetName}] {x|mm/yyyy}: {value|0} MByte'");
}
</script>
<html>
<head>
<script type="text/javascript" src="cdjcv.js"></script>
</head>
<body>
<chart:WebChartViewer id="WebChartViewer1" runat="server" />
</body>
</html>
[ASP.NET Web Forms - VB Version] NetWebCharts\VBNetASP\rotatedline.aspx
(Click here on how to convert this code to code-behind style.)<%@ Page Language="VB" Debug="true" %>
<%@ Import Namespace="ChartDirector" %>
<%@ Register TagPrefix="chart" Namespace="ChartDirector" Assembly="netchartdir" %>
<!DOCTYPE html>
<script runat="server">
'
' Page Load event handler
'
Protected Sub Page_Load(ByVal sender As System.Object, ByVal e As System.EventArgs)
'
' We use a random table to simulate generating 12 months of data
'
' Create the random table object with 4 cols * 12 rows, using 3 as seed
Dim rantable As RanTable = New RanTable(3, 4, 12)
' Set the 1st column to be the 12 months of year 2002
rantable.setDateCol(0, DateSerial(2002, 1, 1), 86400 * 30)
' Set the 2nd, 3rd and 4th columns to be random numbers starting from 125, 75, and 100
' respectively. The change between rows is set to -35 to + 35. The minimum value of any cell is
' 0.
rantable.setCol(1, 125, -35, 35, 0)
rantable.setCol(2, 75, -35, 35, 0)
rantable.setCol(3, 100, -35, 35, 0)
' Get the 1st column (time) as the x data
Dim dataX() As Double = rantable.getCol(0)
' Get the 2nd, 3rd and 4th columns as 3 data sets
Dim dataY0() As Double = rantable.getCol(1)
Dim dataY1() As Double = rantable.getCol(2)
Dim dataY2() As Double = rantable.getCol(3)
' Create a XYChart object of size 360 x 400 pixels
Dim c As XYChart = New XYChart(360, 400)
' Add a title to the chart
c.addTitle("<*underline=2*>Rotated Line Chart Demo", "Times New Roman Bold Italic", 14)
' Set the plotarea at (60, 75) and of size 190 x 320 pixels. Turn on both horizontal and
' vertical grid lines with light grey color (0xc0c0c0)
c.setPlotArea(60, 75, 190, 320).setGridColor(&Hc0c0c0, &Hc0c0c0)
' Add a legend box at (270, 75)
c.addLegend(270, 75)
' Swap the x and y axis to become a rotated chart
c.swapXY()
' Set the y axis on the top side (right + rotated = top)
c.setYAxisOnRight()
' Add a title to the y axis
c.yAxis().setTitle("Throughput (MBytes)")
' Reverse the x axis so it is pointing downwards
c.xAxis().setReverse()
' Add a line chart layer using the given data
Dim layer As LineLayer = c.addLineLayer2()
layer.setXData(dataX)
layer.addDataSet(dataY0, &Hff0000, "Server A")
layer.addDataSet(dataY1, &H338033, "Server B")
layer.addDataSet(dataY2, &H0000ff, "Server C")
' Set the line width to 2 pixels
layer.setLineWidth(2)
' Output the chart
WebChartViewer1.Image = c.makeWebImage(Chart.SVG)
' Include tool tip for the chart
WebChartViewer1.ImageMap = c.getHTMLImageMap("", "", _
"title='[{dataSetName}] {x|mm/yyyy}: {value|0} MByte'")
End Sub
</script>
<html>
<head>
<script type="text/javascript" src="cdjcv.js"></script>
</head>
<body>
<chart:WebChartViewer id="WebChartViewer1" runat="server" />
</body>
</html>
[ASP.NET MVC - Controller] NetMvcCharts\Controllers\RotatedlineController.cs
using System;
using System.Web.Mvc;
using ChartDirector;

namespace NetMvcCharts.Controllers
{
    public class RotatedlineController : Controller
    {
        //
        // Default Action
        //
        public ActionResult Index()
        {
            ViewBag.Title = "Rotated Line Chart";
            createChart(ViewBag.Viewer = new RazorChartViewer(HttpContext, "chart1"));
            return View("~/Views/Shared/ChartView.cshtml");
        }

        //
        // Create chart
        //
        private void createChart(RazorChartViewer viewer)
        {
            //
            //    We use a random table to simulate generating 12 months of data
            //

            // Create the random table object with 4 cols * 12 rows, using 3 as seed
            RanTable rantable = new RanTable(3, 4, 12);

            // Set the 1st column to be the 12 months of year 2002
            rantable.setDateCol(0, new DateTime(2002, 1, 1), 86400 * 30);

            // Set the 2nd, 3rd and 4th columns to be random numbers starting from 125, 75, and 100
            // respectively. The change between rows is set to -35 to + 35. The minimum value of any cell
            // is 0.
            rantable.setCol(1, 125, -35, 35, 0);
            rantable.setCol(2, 75, -35, 35, 0);
            rantable.setCol(3, 100, -35, 35, 0);

            // Get the 1st column (time) as the x data
            double[] dataX = rantable.getCol(0);

            // Get the 2nd, 3rd and 4th columns as 3 data sets
            double[] dataY0 = rantable.getCol(1);
            double[] dataY1 = rantable.getCol(2);
            double[] dataY2 = rantable.getCol(3);

            // Create a XYChart object of size 360 x 400 pixels
            XYChart c = new XYChart(360, 400);

            // Add a title to the chart
            c.addTitle("<*underline=2*>Rotated Line Chart Demo", "Times New Roman Bold Italic", 14);

            // Set the plotarea at (60, 75) and of size 190 x 320 pixels. Turn on both horizontal and
            // vertical grid lines with light grey color (0xc0c0c0)
            c.setPlotArea(60, 75, 190, 320).setGridColor(0xc0c0c0, 0xc0c0c0);

            // Add a legend box at (270, 75)
            c.addLegend(270, 75);

            // Swap the x and y axis to become a rotated chart
            c.swapXY();

            // Set the y axis on the top side (right + rotated = top)
            c.setYAxisOnRight();

            // Add a title to the y axis
            c.yAxis().setTitle("Throughput (MBytes)");

            // Reverse the x axis so it is pointing downwards
            c.xAxis().setReverse();

            // Add a line chart layer using the given data
            LineLayer layer = c.addLineLayer2();
            layer.setXData(dataX);
            layer.addDataSet(dataY0, 0xff0000, "Server A");
            layer.addDataSet(dataY1, 0x338033, "Server B");
            layer.addDataSet(dataY2, 0x0000ff, "Server C");

            // Set the line width to 2 pixels
            layer.setLineWidth(2);

            // Output the chart
            viewer.Image = c.makeWebImage(Chart.SVG);

            // Include tool tip for the chart
            viewer.ImageMap = c.getHTMLImageMap("", "",
                "title='[{dataSetName}] {x|mm/yyyy}: {value|0} MByte'");
        }
    }
}
[ASP.NET MVC - View] NetMvcCharts\Views\Shared\ChartView.cshtml
@{ Layout = null; }

<!DOCTYPE html>

<html>
<head>
    <meta name="viewport" content="width=device-width" />
    <title>@ViewBag.Title</title>
    <style>
        @ViewBag.Style
    </style>
    @Scripts.Render("~/Scripts/cdjcv.js")
</head>
<body style="margin:5px 0px 0px 5px">
    <div style="font:bold 18pt verdana;">
        @ViewBag.Title
    </div>
    <hr style="border:solid 1px #000080; background:#000080" />
    <div>
        @{
            if (ViewBag.Viewer is Array)
            {
                // Display multiple charts
                for (int i = 0; i < ViewBag.Viewer.Length; ++i)
                {
                    @:@Html.Raw(ViewBag.Viewer[i].RenderHTML())
                }
            }
            else
            {
                // Display one chart only
                @:@Html.Raw(ViewBag.Viewer.RenderHTML())
            }
        }
    </div>
</body>
</html>
© 2023 Advanced Software Engineering Limited. All rights reserved.