[Windows Forms - C# version] NetWinCharts\CSharpWinCharts\shadowpie.cs
using System;
using ChartDirector;
namespace CSharpChartExplorer
{
public class shadowpie : DemoModule
{
//Name of demo module
public string getName() { return "3D Shadow Mode"; }
//Number of charts produced in this demo module
public int getNoOfCharts() { return 4; }
//Main code for creating charts
public void createChart(WinChartViewer viewer, int chartIndex)
{
// the tilt angle of the pie
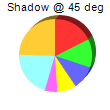
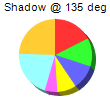
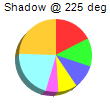
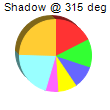
int angle = chartIndex * 90 + 45;
// The data for the pie chart
double[] data = {25, 18, 15, 12, 8, 30, 35};
// The labels for the pie chart
string[] labels = {"Labor", "Licenses", "Taxes", "Legal", "Insurance", "Facilities",
"Production"};
// Create a PieChart object of size 110 x 110 pixels
PieChart c = new PieChart(110, 110);
// Set the center of the pie at (50, 55) and the radius to 36 pixels
c.setPieSize(55, 55, 36);
// Set the depth, tilt angle and 3D mode of the 3D pie (-1 means auto depth, "true"
// means the 3D effect is in shadow mode)
c.set3D(-1, angle, true);
// Add a title showing the shadow angle
c.addTitle("Shadow @ " + angle + " deg", "Arial", 8);
// Set the pie data
c.setData(data, labels);
// Disable the sector labels by setting the color to Transparent
c.setLabelStyle("", 8, Chart.Transparent);
// Output the chart
viewer.Chart = c;
//include tool tip for the chart
viewer.ImageMap = c.getHTMLImageMap("clickable", "",
"title='{label}: US${value}K ({percent}%)'");
}
}
}
[Windows Forms - VB Version] NetWinCharts\VBNetWinCharts\shadowpie.vb
Imports System
Imports Microsoft.VisualBasic
Imports ChartDirector

Public Class shadowpie
    Implements DemoModule

    'Name of demo module
    Public Function getName() As String Implements DemoModule.getName
        Return "3D Shadow Mode"
    End Function

    'Number of charts produced in this demo module
    Public Function getNoOfCharts() As Integer Implements DemoModule.getNoOfCharts
        Return 4
    End Function

    'Main code for creating charts
    Public Sub createChart(viewer As WinChartViewer, chartIndex As Integer) _
        Implements DemoModule.createChart

        ' the tilt angle of the pie
        Dim angle As Integer = chartIndex * 90 + 45

        ' The data for the pie chart
        Dim data() As Double = {25, 18, 15, 12, 8, 30, 35}

        ' The labels for the pie chart
        Dim labels() As String = {"Labor", "Licenses", "Taxes", "Legal", "Insurance", _
            "Facilities", "Production"}

        ' Create a PieChart object of size 110 x 110 pixels
        Dim c As PieChart = New PieChart(110, 110)

        ' Set the center of the pie at (50, 55) and the radius to 36 pixels
        c.setPieSize(55, 55, 36)

        ' Set the depth, tilt angle and 3D mode of the 3D pie (-1 means auto depth, "true" means the
        ' 3D effect is in shadow mode)
        c.set3D(-1, angle, True)

        ' Add a title showing the shadow angle
        c.addTitle("Shadow @ " & angle & " deg", "Arial", 8)

        ' Set the pie data
        c.setData(data, labels)

        ' Disable the sector labels by setting the color to Transparent
        c.setLabelStyle("", 8, Chart.Transparent)

        ' Output the chart
        viewer.Chart = c

        'include tool tip for the chart
        viewer.ImageMap = c.getHTMLImageMap("clickable", "", _
            "title='{label}: US${value}K ({percent}%)'")

    End Sub

End Class
[WPF - C#] NetWPFCharts\CSharpWPFCharts\shadowpie.cs
using System;
using ChartDirector;

namespace CSharpWPFCharts
{
    public class shadowpie : DemoModule
    {
        //Name of demo module
        public string getName() { return "3D Shadow Mode"; }

        //Number of charts produced in this demo module
        public int getNoOfCharts() { return 4; }

        //Main code for creating charts
        public void createChart(WPFChartViewer viewer, int chartIndex)
        {
            // the tilt angle of the pie
            int angle = chartIndex * 90 + 45;

            // The data for the pie chart
            double[] data = {25, 18, 15, 12, 8, 30, 35};

            // The labels for the pie chart
            string[] labels = {"Labor", "Licenses", "Taxes", "Legal", "Insurance", "Facilities",
                "Production"};

            // Create a PieChart object of size 110 x 110 pixels
            PieChart c = new PieChart(110, 110);

            // Set the center of the pie at (50, 55) and the radius to 36 pixels
            c.setPieSize(55, 55, 36);

            // Set the depth, tilt angle and 3D mode of the 3D pie (-1 means auto depth, "true"
            // means the 3D effect is in shadow mode)
            c.set3D(-1, angle, true);

            // Add a title showing the shadow angle
            c.addTitle("Shadow @ " + angle + " deg", "Arial", 8);

            // Set the pie data
            c.setData(data, labels);

            // Disable the sector labels by setting the color to Transparent
            c.setLabelStyle("", 8, Chart.Transparent);

            // Output the chart
            viewer.Chart = c;

            //include tool tip for the chart
            viewer.ImageMap = c.getHTMLImageMap("clickable", "",
                "title='{label}: US${value}K ({percent}%)'");
        }
    }
}
[ASP.NET Web Forms - C# version] NetWebCharts\CSharpASP\shadowpie.aspx
(Click here on how to convert this code to code-behind style.)<%@ Page Language="C#" Debug="true" %>
<%@ Import Namespace="ChartDirector" %>
<%@ Register TagPrefix="chart" Namespace="ChartDirector" Assembly="netchartdir" %>
<!DOCTYPE html>
<script runat="server">
//
// Create chart
//
protected void createChart(WebChartViewer viewer, int chartIndex)
{
// the tilt angle of the pie
int angle = chartIndex * 90 + 45;
// The data for the pie chart
double[] data = {25, 18, 15, 12, 8, 30, 35};
// The labels for the pie chart
string[] labels = {"Labor", "Licenses", "Taxes", "Legal", "Insurance", "Facilities",
"Production"};
// Create a PieChart object of size 110 x 110 pixels
PieChart c = new PieChart(110, 110);
// Set the center of the pie at (50, 55) and the radius to 36 pixels
c.setPieSize(55, 55, 36);
// Set the depth, tilt angle and 3D mode of the 3D pie (-1 means auto depth, "true" means the 3D
// effect is in shadow mode)
c.set3D(-1, angle, true);
// Add a title showing the shadow angle
c.addTitle("Shadow @ " + angle + " deg", "Arial", 8);
// Set the pie data
c.setData(data, labels);
// Disable the sector labels by setting the color to Transparent
c.setLabelStyle("", 8, Chart.Transparent);
// Output the chart
viewer.Image = c.makeWebImage(Chart.SVG);
// Include tool tip for the chart
viewer.ImageMap = c.getHTMLImageMap("", "", "title='{label}: US${value}K ({percent}%)'");
}
//
// Page Load event handler
//
protected void Page_Load(object sender, EventArgs e)
{
createChart(WebChartViewer0, 0);
createChart(WebChartViewer1, 1);
createChart(WebChartViewer2, 2);
createChart(WebChartViewer3, 3);
}
</script>
<html>
<head>
<script type="text/javascript" src="cdjcv.js"></script>
</head>
<body>
<chart:WebChartViewer id="WebChartViewer0" runat="server" />
<chart:WebChartViewer id="WebChartViewer1" runat="server" />
<chart:WebChartViewer id="WebChartViewer2" runat="server" />
<chart:WebChartViewer id="WebChartViewer3" runat="server" />
</body>
</html>
[ASP.NET Web Forms - VB Version] NetWebCharts\VBNetASP\shadowpie.aspx
(Click here on how to convert this code to code-behind style.)<%@ Page Language="VB" Debug="true" %>
<%@ Import Namespace="ChartDirector" %>
<%@ Register TagPrefix="chart" Namespace="ChartDirector" Assembly="netchartdir" %>
<!DOCTYPE html>
<script runat="server">
'
' Create chart
'
Protected Sub createChart(viewer As WebChartViewer, chartIndex As Integer)
' the tilt angle of the pie
Dim angle As Integer = chartIndex * 90 + 45
' The data for the pie chart
Dim data() As Double = {25, 18, 15, 12, 8, 30, 35}
' The labels for the pie chart
Dim labels() As String = {"Labor", "Licenses", "Taxes", "Legal", "Insurance", "Facilities", _
"Production"}
' Create a PieChart object of size 110 x 110 pixels
Dim c As PieChart = New PieChart(110, 110)
' Set the center of the pie at (50, 55) and the radius to 36 pixels
c.setPieSize(55, 55, 36)
' Set the depth, tilt angle and 3D mode of the 3D pie (-1 means auto depth, "true" means the 3D
' effect is in shadow mode)
c.set3D(-1, angle, True)
' Add a title showing the shadow angle
c.addTitle("Shadow @ " & angle & " deg", "Arial", 8)
' Set the pie data
c.setData(data, labels)
' Disable the sector labels by setting the color to Transparent
c.setLabelStyle("", 8, Chart.Transparent)
' Output the chart
viewer.Image = c.makeWebImage(Chart.SVG)
' Include tool tip for the chart
viewer.ImageMap = c.getHTMLImageMap("", "", "title='{label}: US${value}K ({percent}%)'")
End Sub
'
' Page Load event handler
'
Protected Sub Page_Load(ByVal sender As System.Object, ByVal e As System.EventArgs)
createChart(WebChartViewer0, 0)
createChart(WebChartViewer1, 1)
createChart(WebChartViewer2, 2)
createChart(WebChartViewer3, 3)
End Sub
</script>
<html>
<head>
<script type="text/javascript" src="cdjcv.js"></script>
</head>
<body>
<chart:WebChartViewer id="WebChartViewer0" runat="server" />
<chart:WebChartViewer id="WebChartViewer1" runat="server" />
<chart:WebChartViewer id="WebChartViewer2" runat="server" />
<chart:WebChartViewer id="WebChartViewer3" runat="server" />
</body>
</html>
[ASP.NET MVC - Controller] NetMvcCharts\Controllers\ShadowpieController.cs
using System;
using System.Web.Mvc;
using ChartDirector;

namespace NetMvcCharts.Controllers
{
    public class ShadowpieController : Controller
    {
        //
        // Default Action
        //
        public ActionResult Index()
        {
            ViewBag.Title = "3D Shadow Mode";

            // This example contains 4 charts.
            ViewBag.Viewer = new RazorChartViewer[4];
            for (int i = 0; i < ViewBag.Viewer.Length; ++i)
                createChart(ViewBag.Viewer[i] = new RazorChartViewer(HttpContext, "chart" + i), i);

            return View("~/Views/Shared/ChartView.cshtml");
        }

        //
        // Create chart
        //
        private void createChart(RazorChartViewer viewer, int chartIndex)
        {
            // the tilt angle of the pie
            int angle = chartIndex * 90 + 45;

            // The data for the pie chart
            double[] data = {25, 18, 15, 12, 8, 30, 35};

            // The labels for the pie chart
            string[] labels = {"Labor", "Licenses", "Taxes", "Legal", "Insurance", "Facilities",
                "Production"};

            // Create a PieChart object of size 110 x 110 pixels
            PieChart c = new PieChart(110, 110);

            // Set the center of the pie at (50, 55) and the radius to 36 pixels
            c.setPieSize(55, 55, 36);

            // Set the depth, tilt angle and 3D mode of the 3D pie (-1 means auto depth, "true" means the
            // 3D effect is in shadow mode)
            c.set3D(-1, angle, true);

            // Add a title showing the shadow angle
            c.addTitle("Shadow @ " + angle + " deg", "Arial", 8);

            // Set the pie data
            c.setData(data, labels);

            // Disable the sector labels by setting the color to Transparent
            c.setLabelStyle("", 8, Chart.Transparent);

            // Output the chart
            viewer.Image = c.makeWebImage(Chart.SVG);

            // Include tool tip for the chart
            viewer.ImageMap = c.getHTMLImageMap("", "", "title='{label}: US${value}K ({percent}%)'");
        }
    }
}
[ASP.NET MVC - View] NetMvcCharts\Views\Shared\ChartView.cshtml
@{ Layout = null; }

<!DOCTYPE html>

<html>
<head>
    <meta name="viewport" content="width=device-width" />
    <title>@ViewBag.Title</title>
    <style>
        @ViewBag.Style
    </style>
    @Scripts.Render("~/Scripts/cdjcv.js")
</head>
<body style="margin:5px 0px 0px 5px">
    <div style="font:bold 18pt verdana;">
        @ViewBag.Title
    </div>
    <hr style="border:solid 1px #000080; background:#000080" />
    <div>
        @{
            if (ViewBag.Viewer is Array)
            {
                // Display multiple charts
                for (int i = 0; i < ViewBag.Viewer.Length; ++i)
                {
                    @:@Html.Raw(ViewBag.Viewer[i].RenderHTML())
                }
            }
            else
            {
                // Display one chart only
                @:@Html.Raw(ViewBag.Viewer.RenderHTML())
            }
        }
    </div>
</body>
</html>
© 2023 Advanced Software Engineering Limited. All rights reserved.