[Windows Forms - C# version] NetWinCharts\CSharpWinCharts\frmsimplezoomscroll.cs
using System;
using System.Collections;
using System.Windows.Forms;
using ChartDirector;
namespace CSharpChartExplorer
{
public partial class FrmSimpleZoomScroll : Form
{
// Data arrays
private DateTime[] timeStamps;
private double[] dataSeriesA;
private double[] dataSeriesB;
private double[] dataSeriesC;
public FrmSimpleZoomScroll()
{
InitializeComponent();
}
private void FrmSimpleZoomScroll_Load(object sender, EventArgs e)
{
// Load the data
loadData();
// Initialize the WinChartViewer
initChartViewer(winChartViewer1);
// Trigger the ViewPortChanged event to draw the chart
winChartViewer1.updateViewPort(true, true);
}
//
// Load the data
//
private void loadData()
{
// In this example, we just use random numbers as data.
RanSeries r = new RanSeries(127);
timeStamps = r.getDateSeries(1827, new DateTime(2015, 1, 1), 86400);
dataSeriesA = r.getSeries2(1827, 150, -10, 10);
dataSeriesB = r.getSeries2(1827, 200, -10, 10);
dataSeriesC = r.getSeries2(1827, 250, -8, 8);
}
//
// Initialize the WinChartViewer
//
private void initChartViewer(WinChartViewer viewer)
{
// Set the full x range to be the duration of the data
viewer.setFullRange("x", timeStamps[0], timeStamps[timeStamps.Length - 1]);
// Initialize the view port to show the latest 20% of the time range
viewer.ViewPortWidth = 0.2;
viewer.ViewPortLeft = 1 - viewer.ViewPortWidth;
// Set the maximum zoom to 10 points
viewer.ZoomInWidthLimit = 10.0 / timeStamps.Length;
// Initially set the mouse usage to "Pointer" mode (Drag to Scroll mode)
pointerPB.Checked = true;
}
//
// The ViewPortChanged event handler. This event occurs if the user scrolls or zooms in
// or out the chart by dragging or clicking on the chart. It can also be triggered by
// calling WinChartViewer.updateViewPort.
//
private void winChartViewer1_ViewPortChanged(object sender, WinViewPortEventArgs e)
{
if (e.NeedUpdateChart)
drawChart(winChartViewer1);
if (e.NeedUpdateImageMap)
updateImageMap(winChartViewer1);
}
//
// Draw the chart.
//
private void drawChart(WinChartViewer viewer)
{
// Get the start date and end date that are visible on the chart.
DateTime viewPortStartDate = Chart.NTime(viewer.getValueAtViewPort("x", viewer.ViewPortLeft));
DateTime viewPortEndDate = Chart.NTime(viewer.getValueAtViewPort("x", viewer.ViewPortRight));
// Get the array indexes that corresponds to the visible start and end dates
int startIndex = (int)Math.Floor(Chart.bSearch(timeStamps, viewPortStartDate));
int endIndex = (int)Math.Ceiling(Chart.bSearch(timeStamps, viewPortEndDate));
int noOfPoints = endIndex - startIndex + 1;
// Extract the part of the data array that are visible.
DateTime[] viewPortTimeStamps = Chart.arraySlice(timeStamps, startIndex, noOfPoints);
double[] viewPortDataSeriesA = Chart.arraySlice(dataSeriesA, startIndex, noOfPoints);
double[] viewPortDataSeriesB = Chart.arraySlice(dataSeriesB, startIndex, noOfPoints);
double[] viewPortDataSeriesC = Chart.arraySlice(dataSeriesC, startIndex, noOfPoints);
//
// At this stage, we have extracted the visible data. We can use those data to plot the chart.
//
//================================================================================
// Configure overall chart appearance.
//================================================================================
// Create an XYChart object 600 x 300 pixels in size, with pale blue (0xf0f0ff) background,
// black (000000) rounded border, 1 pixel raised effect.
XYChart c = new XYChart(600, 300, 0xf0f0ff, 0, 1);
c.setRoundedFrame(Chart.CColor(BackColor));
// Set the plotarea at (52, 60) and of size 520 x 205 pixels. Use white (ffffff) background.
// Enable both horizontal and vertical grids by setting their colors to grey (cccccc). Set
// clipping mode to clip the data lines to the plot area.
c.setPlotArea(52, 60, 520, 205, 0xffffff, -1, -1, 0xcccccc, 0xcccccc);
// As the data can lie outside the plotarea in a zoomed chart, we need to enable clipping.
c.setClipping();
// Add a top title to the chart using 15 pts Times New Roman Bold Italic font, with a light blue
// (ccccff) background, black (000000) border, and a glass like raised effect.
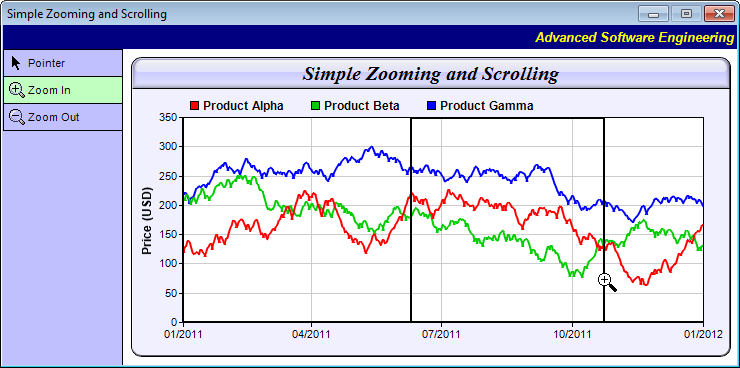
c.addTitle("Simple Zooming and Scrolling", "Times New Roman Bold Italic", 15
).setBackground(0xccccff, 0x0, Chart.glassEffect());
// Add a legend box at the top of the plot area with 9pts Arial Bold font with flow layout.
c.addLegend(50, 33, false, "Arial Bold", 9).setBackground(Chart.Transparent, Chart.Transparent);
// Set axes width to 2 pixels
c.yAxis().setWidth(2);
c.xAxis().setWidth(2);
// Add a title to the y-axis
c.yAxis().setTitle("Price (USD)", "Arial Bold", 9);
//================================================================================
// Add data to chart
//================================================================================
//
// In this example, we represent the data by lines. You may modify the code below to use other
// representations (areas, scatter plot, etc).
//
// Add a line layer for the lines, using a line width of 2 pixels
LineLayer layer = c.addLineLayer2();
layer.setLineWidth(2);
// In this demo, we do not have too many data points. In real code, the chart may contain a lot
// of data points when fully zoomed out - much more than the number of horizontal pixels in this
// plot area. So it is a good idea to use fast line mode.
layer.setFastLineMode();
// Now we add the 3 data series to a line layer, using the color red (ff0000), green (00cc00)
// and blue (0000ff)
layer.setXData(viewPortTimeStamps);
layer.addDataSet(viewPortDataSeriesA, 0xff0000, "Product Alpha");
layer.addDataSet(viewPortDataSeriesB, 0x00cc00, "Product Beta");
layer.addDataSet(viewPortDataSeriesC, 0x0000ff, "Product Gamma");
//================================================================================
// Configure axis scale and labelling
//================================================================================
// Set the x-axis as a date/time axis with the scale according to the view port x range.
viewer.syncDateAxisWithViewPort("x", c.xAxis());
// In this demo, we rely on ChartDirector to auto-label the axis. We ask ChartDirector to ensure
// the x-axis labels are at least 75 pixels apart to avoid too many labels.
c.xAxis().setTickDensity(75);
//================================================================================
// Output the chart
//================================================================================
viewer.Chart = c;
}
//
// Update the image map
//
private void updateImageMap(WinChartViewer viewer)
{
// Include tool tip for the chart
if (winChartViewer1.ImageMap == null)
{
winChartViewer1.ImageMap = winChartViewer1.Chart.getHTMLImageMap("", "",
"title='[{dataSetName}] {x|mmm dd, yyyy}: USD {value|2}'");
}
}
//
// Pointer (Drag to Scroll) button event handler
//
private void pointerPB_CheckedChanged(object sender, EventArgs e)
{
if (((RadioButton)sender).Checked)
winChartViewer1.MouseUsage = WinChartMouseUsage.ScrollOnDrag;
}
//
// Zoom In button event handler
//
private void zoomInPB_CheckedChanged(object sender, EventArgs e)
{
if (((RadioButton)sender).Checked)
winChartViewer1.MouseUsage = WinChartMouseUsage.ZoomIn;
}
//
// Zoom Out button event handler
//
private void zoomOutPB_CheckedChanged(object sender, EventArgs e)
{
if (((RadioButton)sender).Checked)
winChartViewer1.MouseUsage = WinChartMouseUsage.ZoomOut;
}
}
}
[Windows Forms - VB Version] NetWinCharts\VBNetWinCharts\frmsimplezoomscroll.vb
Imports ChartDirector

Public Class FrmSimpleZoomScroll

    ' Data arrays
    Dim timeStamps As DateTime()
    Dim dataSeriesA As Double()
    Dim dataSeriesB As Double()
    Dim dataSeriesC As Double()

    Private Sub FrmSimpleZoomScroll_Load(ByVal sender As Object, ByVal e As EventArgs) Handles MyBase.Load

        ' Load the data
        loadData()

        ' Initialize the WinChartViewer
        initChartViewer(winChartViewer1)

        ' Trigger the ViewPortChanged event to draw the chart
        winChartViewer1.updateViewPort(True, True)

    End Sub

    '
    ' Load the data
    '
    Private Sub loadData()

        ' In this example, we just use random numbers as data.
        Dim r As RanSeries = New RanSeries(127)
        timeStamps = r.getDateSeries(1827, New DateTime(2015, 1, 1), 86400)
        dataSeriesA = r.getSeries2(1827, 150, -10, 10)
        dataSeriesB = r.getSeries2(1827, 200, -10, 10)
        dataSeriesC = r.getSeries2(1827, 250, -8, 8)

    End Sub

    '
    ' Initialize the WinChartViewer
    '
    Private Sub initChartViewer(ByVal viewer As WinChartViewer)

        ' Set the full x range to be the duration of the data
        viewer.setFullRange("x", timeStamps(0), timeStamps(timeStamps.Length - 1))

        ' Initialize the view port to show the latest 20% of the time range
        viewer.ViewPortWidth = 0.2
        viewer.ViewPortLeft = 1 - viewer.ViewPortWidth

        ' Set the maximum zoom to 10 points
        viewer.ZoomInWidthLimit = 10.0 / timeStamps.Length

        '/ Initially set the mouse usage to "Pointer" mode (Drag to Scroll mode)
        pointerPB.Checked = True

    End Sub

    '
    ' The ViewPortChanged event handler. This event occurs if the user scrolls or zooms in
    ' or out the chart by dragging or clicking on the chart. It can also be triggered by
    ' calling WinChartViewer.updateViewPort.
    '
    Private Sub winChartViewer1_ViewPortChanged(ByVal sender As Object, ByVal e As WinViewPortEventArgs) _
        Handles winChartViewer1.ViewPortChanged

        If e.NeedUpdateChart Then
            drawChart(winChartViewer1)
        End If
        If e.NeedUpdateImageMap Then
            updateImageMap(winChartViewer1)
        End If

    End Sub

    '
    ' Draw the chart.
    '
    Private Sub drawChart(ByVal viewer As WinChartViewer)

        ' Get the start date and end date that are visible on the chart.
        Dim viewPortStartDate As DateTime = Chart.NTime(viewer.GetValueAtViewPort("x", viewer.ViewPortLeft))
        Dim viewPortEndDate As DateTime = Chart.NTime(viewer.getValueAtViewPort("x", viewer.ViewPortRight))

        ' Get the array indexes that corresponds to the visible start and end dates
        Dim startIndex As Integer = Math.Floor(Chart.bSearch(timeStamps, viewPortStartDate))
        Dim endIndex As Integer = Math.Ceiling(Chart.bSearch(timeStamps, viewPortEndDate))
        Dim noOfPoints As Integer = endIndex - startIndex + 1

        ' Extract the part of the data array that are visible.
        Dim viewPortTimeStamps As DateTime() = Chart.arraySlice(timeStamps, startIndex, noOfPoints)
        Dim viewPortDataSeriesA As Double() = Chart.arraySlice(dataSeriesA, startIndex, noOfPoints)
        Dim viewPortDataSeriesB As Double() = Chart.arraySlice(dataSeriesB, startIndex, noOfPoints)
        Dim viewPortDataSeriesC As Double() = Chart.arraySlice(dataSeriesC, startIndex, noOfPoints)

        '
        ' At this stage, we have extracted the visible data. We can use those data to plot the chart.
        '

        '================================================================================
        ' Configure overall chart appearance.
        '================================================================================

        ' Create an XYChart object 600 x 300 pixels in size, with pale blue (f0f0ff)
        ' background, black (000000) border, 1 pixel raised effect, and with a rounded frame.
        Dim c As XYChart = New XYChart(600, 300, &HF0F0FF, 0, 1)
        c.setRoundedFrame(Chart.CColor(BackColor))

        ' Set the plotarea at (52, 60) and of size 520 x 205 pixels. Use white (ffffff) background.
        ' Enable both horizontal and vertical grids by setting their colors to grey (cccccc). Set
        ' clipping mode to clip the data lines to the plot area.
        c.setPlotArea(52, 60, 520, 205, &HFFFFFF, -1, -1, &HCCCCCC, &HCCCCCC)
        ' As the data can lie outside the plotarea in a zoomed chart, we need to enable clipping.
        c.setClipping()

        ' Add a top title to the chart using 15 pts Times New Roman Bold Italic font, with a light blue
        ' (ccccff) background, black (000000) border, and a glass like raised effect.
        c.addTitle("Simple Zooming and Scrolling", "Times New Roman Bold Italic", 15 _
                ).setBackground(&HCCCCFF, &H0, Chart.glassEffect())

        ' Add a legend box at the top of the plot area with 9pts Arial Bold font with flow layout.
        c.addLegend(50, 33, False, "Arial Bold", 9).setBackground(Chart.Transparent, Chart.Transparent)

        ' Set axes width to 2 pixels
        c.yAxis().setWidth(2)
        c.xAxis().setWidth(2)

        ' Add a title to the y-axis
        c.yAxis().setTitle("Price (USD)", "Arial Bold", 9)

        '================================================================================
        ' Add data to chart
        '================================================================================

        '
        ' In this example, we represent the data by lines. You may modify the code below to use other
        ' representations (areas, scatter plot, etc).
        '

        ' Add a line layer for the lines, using a line width of 2 pixels
        Dim layer As LineLayer = c.addLineLayer2()
        layer.setLineWidth(2)

        ' In this demo, we do not have too many data points. In real code, the chart may contain a lot
        ' of data points when fully zoomed out - much more than the number of horizontal pixels in this
        ' plot area. So it is a good idea to use fast line mode.
        layer.setFastLineMode()

        ' Now we add the 3 data series to a line layer, using the color red (ff0000), green (00cc00)
        ' and blue (0000ff)
        layer.setXData(viewPortTimeStamps)
        layer.addDataSet(viewPortDataSeriesA, &Hff0000, "Product Alpha")
        layer.addDataSet(viewPortDataSeriesB, &H00cc00, "Product Beta")
        layer.addDataSet(viewPortDataSeriesC, &H0000ff, "Product Gamma")

        '================================================================================
        ' Configure axis scale and labelling
        '================================================================================

        ' Set the x-axis as a date/time axis with the scale according to the view port x range.
        viewer.syncDateAxisWithViewPort("x", c.xAxis())

        ' In this demo, we rely on ChartDirector to auto-label the axis. We ask ChartDirector to ensure
        ' the x-axis labels are at least 75 pixels apart to avoid too many labels.
        c.xAxis().setTickDensity(75)

        '================================================================================
        ' Output the chart
        '================================================================================

        viewer.Chart = c

    End Sub

    '
    ' Update the image map
    '
    Private Sub updateImageMap(ByVal viewer As WinChartViewer)

        ' Include tool tip for the chart
        If IsNothing(winChartViewer1.ImageMap) Then
            winChartViewer1.ImageMap = winChartViewer1.Chart.getHTMLImageMap("", "", _
                "title='[{dataSetName}] {x|mmm dd, yyyy}: USD {value|2}'")
        End If

    End Sub

    '
    ' Pointer (Drag to Scroll) button event handler
    '
    Private Sub pointerPB_CheckedChanged(ByVal sender As Object, ByVal e As EventArgs) _
        Handles pointerPB.CheckedChanged

        If sender.Checked Then
            winChartViewer1.MouseUsage = WinChartMouseUsage.ScrollOnDrag
        End If

    End Sub

    '
    ' Zoom In button event handler
    '
    Private Sub zoomInPB_CheckedChanged(ByVal sender As Object, ByVal e As EventArgs) _
        Handles zoomInPB.CheckedChanged

        If sender.Checked Then
            winChartViewer1.MouseUsage = WinChartMouseUsage.ZoomIn
        End If

    End Sub

    '
    ' Zoom Out button event handler
    '
    Private Sub zoomOutPB_CheckedChanged(ByVal sender As Object, ByVal e As EventArgs) _
        Handles zoomOutPB.CheckedChanged

        If sender.Checked Then
            winChartViewer1.MouseUsage = WinChartMouseUsage.ZoomOut
        End If

    End Sub

End Class
[WPF - XAML] NetWPFCharts\CSharpWPFCharts\SimpleZoomScrollWindow.xaml
<Window x:Class="CSharpWPFCharts.SimpleZoomScrollWindow"
        xmlns="http://schemas.microsoft.com/winfx/2006/xaml/presentation"
        xmlns:x="http://schemas.microsoft.com/winfx/2006/xaml"
        xmlns:d="http://schemas.microsoft.com/expression/blend/2008"
        xmlns:mc="http://schemas.openxmlformats.org/markup-compatibility/2006"
        xmlns:local="clr-namespace:CSharpWPFCharts"
        mc:Ignorable="d"
        xmlns:ChartDirector="clr-namespace:ChartDirector;assembly=netchartdir" UseLayoutRounding="True"
        Title="Simple Zooming and Scrolling" SizeToContent="WidthAndHeight" ResizeMode="NoResize" Loaded="Window_Loaded">
    <DockPanel>
        <Label Content="Advanced Software Engineering" DockPanel.Dock="Top" FontFamily="Arial" FontStyle="Italic" FontWeight="Bold"
               FontSize="13" Background="#FF02098D" Foreground="#FFF4FF04" HorizontalContentAlignment="Right" />
        <StackPanel DockPanel.Dock="Left" Width="120" Background="#FFF0F0F0">
            <RadioButton x:Name="pointerPB" Style="{StaticResource {x:Type ToggleButton}}" HorizontalContentAlignment="Left" Checked="pointerPB_Checked" >
                <StackPanel Orientation="Horizontal" Margin="5">
                    <Image Source="/icons/scroll_icon.png" Height="16" />
                    <TextBlock Text="Scroll" Margin="6,0,0,0" />
                </StackPanel>
            </RadioButton>
            <RadioButton x:Name="zoomInPB" Style="{StaticResource {x:Type ToggleButton}}" HorizontalContentAlignment="Left" Checked="zoomInPB_Checked" >
                <StackPanel Orientation="Horizontal" Margin="5" >
                    <Image Source="/icons/zoomin_icon.png" Height="16" />
                    <TextBlock Text="Zoom In" Margin="6,0,0,0" />
                </StackPanel>
            </RadioButton>
            <RadioButton x:Name="zoomOutPB" Style="{StaticResource {x:Type ToggleButton}}" HorizontalContentAlignment="Left" Checked="zoomOutPB_Checked">
                <StackPanel Orientation="Horizontal" Margin="5" >
                    <Image Source="/icons/zoomout_icon.png" Height="16" />
                    <TextBlock Text="Zoom Out" Margin="6,0,0,0" />
                </StackPanel>
            </RadioButton>
        </StackPanel>
        <ChartDirector:WPFChartViewer x:Name="WPFChartViewer1" Width="600" Height="300" Margin="5" ViewPortChanged="WPFChartViewer1_ViewPortChanged" />
    </DockPanel>
</Window>
[WPF - C#] NetWPFCharts\CSharpWPFCharts\SimpleZoomScrollWindow.xaml.cs
using System;
using System.Windows;
using ChartDirector;

namespace CSharpWPFCharts
{
    public partial class SimpleZoomScrollWindow : Window
    {
        // Data arrays
        private DateTime[] timeStamps;
        private double[] dataSeriesA;
        private double[] dataSeriesB;
        private double[] dataSeriesC;

        public SimpleZoomScrollWindow()
        {
            InitializeComponent();
        }

        private void Window_Loaded(object sender, RoutedEventArgs e)
        {
            // Load the data
            loadData();

            // Initialize the WinChartViewer
            initChartViewer(WPFChartViewer1);

            // Trigger the ViewPortChanged event to draw the chart
            WPFChartViewer1.updateViewPort(true, true);
        }

        //
        // Load the data
        //
        private void loadData()
        {
            // In this example, we just use random numbers as data.
            RanSeries r = new RanSeries(127);
            timeStamps = r.getDateSeries(1827, new DateTime(2015, 1, 1), 86400);
            dataSeriesA = r.getSeries2(1827, 150, -10, 10);
            dataSeriesB = r.getSeries2(1827, 200, -10, 10);
            dataSeriesC = r.getSeries2(1827, 250, -8, 8);
        }

        //
        // Initialize the WinChartViewer
        //
        private void initChartViewer(WPFChartViewer viewer)
        {
            // Set the full x range to be the duration of the data
            viewer.setFullRange("x", timeStamps[0], timeStamps[timeStamps.Length - 1]);

            // Initialize the view port to show the latest 20% of the time range
            viewer.ViewPortWidth = 0.2;
            viewer.ViewPortLeft = 1 - viewer.ViewPortWidth;

            // Set the maximum zoom to 10 points
            viewer.ZoomInWidthLimit = 10.0 / timeStamps.Length;

            // Enable mouse wheel zooming by setting the zoom ratio to 1.1 per wheel event
            viewer.MouseWheelZoomRatio = 1.1;

            // Initially set the mouse usage to "Pointer" mode (Drag to Scroll mode)
            pointerPB.IsChecked = true;
        }

        //
        // The ViewPortChanged event handler. This event occurs if the user scrolls or zooms in
        // or out the chart by dragging or clicking on the chart. It can also be triggered by
        // calling WinChartViewer.updateViewPort.
        //
        private void WPFChartViewer1_ViewPortChanged(object sender, WPFViewPortEventArgs e)
        {
            var viewer = sender as WPFChartViewer;

            if (e.NeedUpdateChart)
                drawChart(viewer);
            if (e.NeedUpdateImageMap)
                updateImageMap(viewer);
        }

        //
        // Update the image map
        //
        private void updateImageMap(WPFChartViewer viewer)
        {
            // Include tool tip for the chart
            if (viewer.ImageMap == null)
            {
                viewer.ImageMap = viewer.Chart.getHTMLImageMap("", "",
                    "title='[{dataSetName}] {x|mmm dd, yyyy}: USD {value|2}'");
            }
        }

        //
        // Draw the chart.
        //
        private void drawChart(WPFChartViewer viewer)
        {
            // Get the start date and end date that are visible on the chart.
            DateTime viewPortStartDate = Chart.NTime(viewer.getValueAtViewPort("x", viewer.ViewPortLeft));
            DateTime viewPortEndDate = Chart.NTime(viewer.getValueAtViewPort("x", viewer.ViewPortRight));

            // Get the array indexes that corresponds to the visible start and end dates
            int startIndex = (int)Math.Floor(Chart.bSearch(timeStamps, viewPortStartDate));
            int endIndex = (int)Math.Ceiling(Chart.bSearch(timeStamps, viewPortEndDate));
            int noOfPoints = endIndex - startIndex + 1;

            // Extract the part of the data array that are visible.
            DateTime[] viewPortTimeStamps = Chart.arraySlice(timeStamps, startIndex, noOfPoints);
            double[] viewPortDataSeriesA = Chart.arraySlice(dataSeriesA, startIndex, noOfPoints);
            double[] viewPortDataSeriesB = Chart.arraySlice(dataSeriesB, startIndex, noOfPoints);
            double[] viewPortDataSeriesC = Chart.arraySlice(dataSeriesC, startIndex, noOfPoints);

            //
            // At this stage, we have extracted the visible data. We can use those data to plot the chart.
            //

            //================================================================================
            // Configure overall chart appearance.
            //================================================================================

            // Create an XYChart object 600 x 300 pixels in size, with pale blue (0xf0f0ff) background,
            // black (000000) rounded border, 1 pixel raised effect.
            XYChart c = new XYChart(600, 300, 0xf0f0ff, 0, 1);
            c.setRoundedFrame(0xffffff);

            // Set the plotarea at (52, 60) and of size 520 x 205 pixels. Use white (ffffff) background.
            // Enable both horizontal and vertical grids by setting their colors to grey (cccccc). Set
            // clipping mode to clip the data lines to the plot area.
            c.setPlotArea(52, 60, 520, 205, 0xffffff, -1, -1, 0xcccccc, 0xcccccc);

            // As the data can lie outside the plotarea in a zoomed chart, we need to enable clipping.
            c.setClipping();

            // Add a top title to the chart using 15 pts Times New Roman Bold Italic font, with a light blue
            // (ccccff) background, black (000000) border, and a glass like raised effect.
            c.addTitle("Simple Zooming and Scrolling", "Times New Roman Bold Italic", 15
                ).setBackground(0xccccff, 0x0, Chart.glassEffect());

            // Add a legend box at the top of the plot area with 9pts Arial Bold font with flow layout.
            c.addLegend(50, 33, false, "Arial Bold", 9).setBackground(Chart.Transparent, Chart.Transparent);

            // Set axes width to 2 pixels
            c.yAxis().setWidth(2);
            c.xAxis().setWidth(2);

            // Add a title to the y-axis
            c.yAxis().setTitle("Price (USD)", "Arial Bold", 9);

            //================================================================================
            // Add data to chart
            //================================================================================

            //
            // In this example, we represent the data by lines. You may modify the code below to use other
            // representations (areas, scatter plot, etc).
            //

            // Add a line layer for the lines, using a line width of 2 pixels
            LineLayer layer = c.addLineLayer2();
            layer.setLineWidth(2);

            // In this demo, we do not have too many data points. In real code, the chart may contain a lot
            // of data points when fully zoomed out - much more than the number of horizontal pixels in this
            // plot area. So it is a good idea to use fast line mode.
            layer.setFastLineMode();

            // Now we add the 3 data series to a line layer, using the color red (ff0000), green (00cc00)
            // and blue (0000ff)
            layer.setXData(viewPortTimeStamps);
            layer.addDataSet(viewPortDataSeriesA, 0xff0000, "Product Alpha");
            layer.addDataSet(viewPortDataSeriesB, 0x00cc00, "Product Beta");
            layer.addDataSet(viewPortDataSeriesC, 0x0000ff, "Product Gamma");

            //================================================================================
            // Configure axis scale and labelling
            //================================================================================

            // Set the x-axis as a date/time axis with the scale according to the view port x range.
            viewer.syncDateAxisWithViewPort("x", c.xAxis());

            // In this demo, we rely on ChartDirector to auto-label the axis. We ask ChartDirector to ensure
            // the x-axis labels are at least 75 pixels apart to avoid too many labels.
            c.xAxis().setTickDensity(75);

            //================================================================================
            // Output the chart
            //================================================================================

            viewer.Chart = c;
        }

        //
        // Pointer (Drag to Scroll) button event handler
        //
        private void pointerPB_Checked(object sender, RoutedEventArgs e)
        {
            WPFChartViewer1.MouseUsage = WinChartMouseUsage.ScrollOnDrag;
        }

        //
        // Zoom In button event handler
        //
        private void zoomInPB_Checked(object sender, RoutedEventArgs e)
        {
            WPFChartViewer1.MouseUsage = WinChartMouseUsage.ZoomIn;
        }

        //
        // Zoom Out button event handler
        //
        private void zoomOutPB_Checked(object sender, RoutedEventArgs e)
        {
            WPFChartViewer1.MouseUsage = WinChartMouseUsage.ZoomOut;
        }
    }
}
© 2023 Advanced Software Engineering Limited. All rights reserved.