[Windows Forms - C# version] NetWinCharts\CSharpWinCharts\surfacecolor.cs
using System;
using ChartDirector;
namespace CSharpChartExplorer
{
public class surfacecolor : DemoModule
{
//Name of demo module
public string getName() { return "Surface Color Scale"; }
//Number of charts produced in this demo module
public int getNoOfCharts() { return 4; }
//Main code for creating charts
public void createChart(WinChartViewer viewer, int chartIndex)
{
// The x and y coordinates of the grid
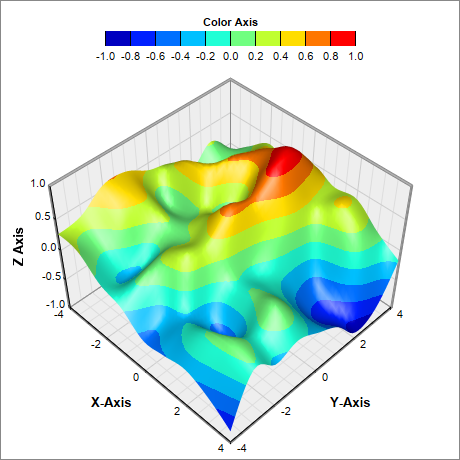
double[] dataX = {-4, -3, -2, -1, 0, 1, 2, 3, 4};
double[] dataY = {-4, -3, -2, -1, 0, 1, 2, 3, 4};
// Use random numbers for the z values on the XY grid
RanSeries r = new RanSeries(99);
double[] dataZ = r.get2DSeries(dataX.Length, dataY.Length, -0.9, 0.9);
// Create a SurfaceChart object of size 460 x 460 pixels with white (0xffffff)
// background and grey (0x888888) border
SurfaceChart c = new SurfaceChart(460, 460, 0xffffff, 0x888888);
// Set the surface data
c.setData(dataX, dataY, dataZ);
// Add a color axis (the legend) in at the top center of the chart, with labels at the
// bottom. Set the axis to flat style.
ColorAxis cAxis = c.setColorAxis(c.getWidth() / 2, 15, Chart.Top, 250, Chart.Bottom);
cAxis.setTitle("Color Axis");
cAxis.setAxisBorder(Chart.Transparent, 0);
// By default, the color axis is synchronized with the z-axis. The following code remove
// the synchronization so that the color axis will auto-scale independently. Set the
// auto-scale minimum tick spacing to 20 pixels.
cAxis.syncAxis(null);
cAxis.setTickDensity(20);
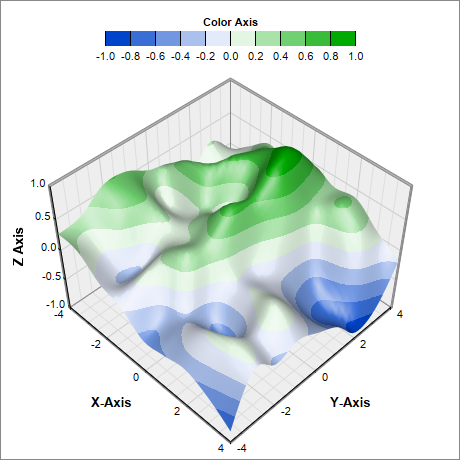
if (chartIndex == 1) {
// Speicify a color gradient as a list of colors, and use it in the color axis.
int[] colorGradient = {0x0044cc, 0xffffff, 0x00aa00};
cAxis.setColorGradient(false, colorGradient);
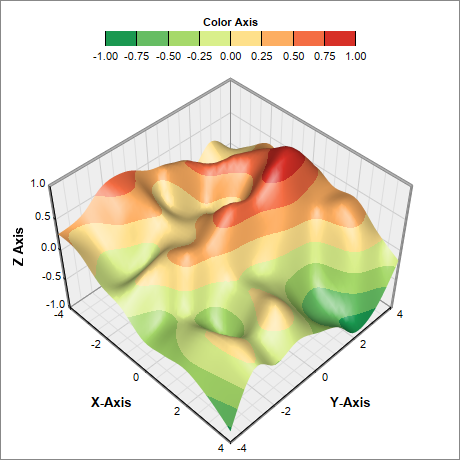
} else if (chartIndex == 2) {
// Specify the color scale to use in the color axis
double[] colorScale = {-1.0, 0x1a9850, -0.75, 0x66bd63, -0.5, 0xa6d96a, -0.25,
0xd9ef8b, 0, 0xfee08b, 0.25, 0xfdae61, 0.5, 0xf46d43, 0.75, 0xd73027, 1};
cAxis.setColorScale(colorScale);
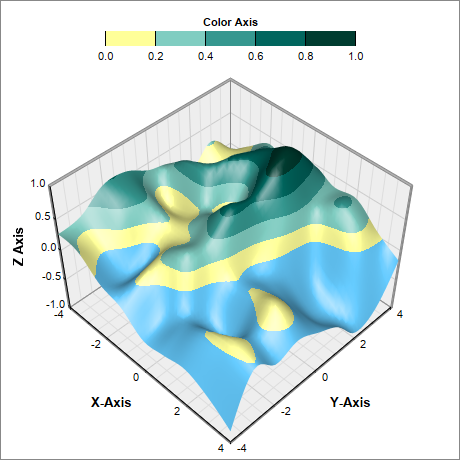
} else if (chartIndex == 3) {
// Specify the color scale to use in the color axis. Also specify an underflow color
// 0x66ccff (blue) for regions that fall below the lower axis limit.
double[] colorScale = {0, 0xffff99, 0.2, 0x80cdc1, 0.4, 0x35978f, 0.6, 0x01665e,
0.8, 0x003c30, 1};
cAxis.setColorScale(colorScale, 0x66ccff);
}
// Set the center of the plot region at (230, 250), and set width x depth x height to
// 240 x 240 x 170 pixels
c.setPlotRegion(230, 250, 240, 240, 170);
// Set the plot region wall thichness to 3 pixels
c.setWallThickness(3);
// Set the elevation and rotation angles to 45 degrees
c.setViewAngle(45, 45);
// Set the perspective level to 20
c.setPerspective(20);
// Spline interpolate data to a 50 x 50 grid for a smooth surface
c.setInterpolation(50, 50);
// Set the axis title
c.xAxis().setTitle("X-Axis", "Arial Bold", 10);
c.yAxis().setTitle("Y-Axis", "Arial Bold", 10);
c.zAxis().setTitle("Z Axis", "Arial Bold", 10);
// Output the chart
viewer.Chart = c;
//include tool tip for the chart
viewer.ImageMap = c.getHTMLImageMap("clickable", "",
"title='<*cdml*>X: {x|2}<*br*>Y: {y|2}<*br*>Z: {z|2}'");
}
}
}
[Windows Forms - VB Version] NetWinCharts\VBNetWinCharts\surfacecolor.vb
Imports System
Imports Microsoft.VisualBasic
Imports ChartDirector

Public Class surfacecolor
    Implements DemoModule

    'Name of demo module
    Public Function getName() As String Implements DemoModule.getName
        Return "Surface Color Scale"
    End Function

    'Number of charts produced in this demo module
    Public Function getNoOfCharts() As Integer Implements DemoModule.getNoOfCharts
        Return 4
    End Function

    'Main code for creating charts
    Public Sub createChart(viewer As WinChartViewer, chartIndex As Integer) _
        Implements DemoModule.createChart

        ' The x and y coordinates of the grid
        Dim dataX() As Double = {-4, -3, -2, -1, 0, 1, 2, 3, 4}
        Dim dataY() As Double = {-4, -3, -2, -1, 0, 1, 2, 3, 4}

        ' Use random numbers for the z values on the XY grid
        Dim r As RanSeries = New RanSeries(99)
        Dim dataZ() As Double = r.get2DSeries(UBound(dataX) + 1, UBound(dataY) + 1, -0.9, 0.9)

        ' Create a SurfaceChart object of size 460 x 460 pixels with white (0xffffff) background and
        ' grey (0x888888) border
        Dim c As SurfaceChart = New SurfaceChart(460, 460, &Hffffff, &H888888)

        ' Set the surface data
        c.setData(dataX, dataY, dataZ)

        ' Add a color axis (the legend) in at the top center of the chart, with labels at the
        ' bottom. Set the axis to flat style.
        Dim cAxis As ColorAxis = c.setColorAxis(c.getWidth() \ 2, 15, Chart.Top, 250, Chart.Bottom)
        cAxis.setTitle("Color Axis")
        cAxis.setAxisBorder(Chart.Transparent, 0)

        ' By default, the color axis is synchronized with the z-axis. The following code remove the
        ' synchronization so that the color axis will auto-scale independently. Set the auto-scale
        ' minimum tick spacing to 20 pixels.
        cAxis.syncAxis(Nothing)
        cAxis.setTickDensity(20)

        If chartIndex = 1 Then
            ' Speicify a color gradient as a list of colors, and use it in the color axis.
            Dim colorGradient() As Integer = {&H0044cc, &Hffffff, &H00aa00}
            cAxis.setColorGradient(False, colorGradient)
        ElseIf chartIndex = 2 Then
            ' Specify the color scale to use in the color axis
            Dim colorScale() As Double = {-1.0, &H1a9850, -0.75, &H66bd63, -0.5, &Ha6d96a, -0.25, _
                &Hd9ef8b, 0, &Hfee08b, 0.25, &Hfdae61, 0.5, &Hf46d43, 0.75, &Hd73027, 1}
            cAxis.setColorScale(colorScale)
        ElseIf chartIndex = 3 Then
            ' Specify the color scale to use in the color axis. Also specify an underflow color
            ' 0x66ccff (blue) for regions that fall below the lower axis limit.
            Dim colorScale() As Double = {0, &Hffff99, 0.2, &H80cdc1, 0.4, &H35978f, 0.6, _
                &H01665e, 0.8, &H003c30, 1}
            cAxis.setColorScale(colorScale, &H66ccff)
        End If

        ' Set the center of the plot region at (230, 250), and set width x depth x height to 240 x
        ' 240 x 170 pixels
        c.setPlotRegion(230, 250, 240, 240, 170)

        ' Set the plot region wall thichness to 3 pixels
        c.setWallThickness(3)

        ' Set the elevation and rotation angles to 45 degrees
        c.setViewAngle(45, 45)

        ' Set the perspective level to 20
        c.setPerspective(20)

        ' Spline interpolate data to a 50 x 50 grid for a smooth surface
        c.setInterpolation(50, 50)

        ' Set the axis title
        c.xAxis().setTitle("X-Axis", "Arial Bold", 10)
        c.yAxis().setTitle("Y-Axis", "Arial Bold", 10)
        c.zAxis().setTitle("Z Axis", "Arial Bold", 10)

        ' Output the chart
        viewer.Chart = c

        'include tool tip for the chart
        viewer.ImageMap = c.getHTMLImageMap("clickable", "", _
            "title='<*cdml*>X: {x|2}<*br*>Y: {y|2}<*br*>Z: {z|2}'")

    End Sub

End Class
[WPF - C#] NetWPFCharts\CSharpWPFCharts\surfacecolor.cs
using System;
using ChartDirector;

namespace CSharpWPFCharts
{
    public class surfacecolor : DemoModule
    {
        //Name of demo module
        public string getName() { return "Surface Color Scale"; }

        //Number of charts produced in this demo module
        public int getNoOfCharts() { return 4; }

        //Main code for creating charts
        public void createChart(WPFChartViewer viewer, int chartIndex)
        {
            // The x and y coordinates of the grid
            double[] dataX = {-4, -3, -2, -1, 0, 1, 2, 3, 4};
            double[] dataY = {-4, -3, -2, -1, 0, 1, 2, 3, 4};

            // Use random numbers for the z values on the XY grid
            RanSeries r = new RanSeries(99);
            double[] dataZ = r.get2DSeries(dataX.Length, dataY.Length, -0.9, 0.9);

            // Create a SurfaceChart object of size 460 x 460 pixels with white (0xffffff)
            // background and grey (0x888888) border
            SurfaceChart c = new SurfaceChart(460, 460, 0xffffff, 0x888888);

            // Set the surface data
            c.setData(dataX, dataY, dataZ);

            // Add a color axis (the legend) in at the top center of the chart, with labels at the
            // bottom. Set the axis to flat style.
            ColorAxis cAxis = c.setColorAxis(c.getWidth() / 2, 15, Chart.Top, 250, Chart.Bottom);
            cAxis.setTitle("Color Axis");
            cAxis.setAxisBorder(Chart.Transparent, 0);

            // By default, the color axis is synchronized with the z-axis. The following code remove
            // the synchronization so that the color axis will auto-scale independently. Set the
            // auto-scale minimum tick spacing to 20 pixels.
            cAxis.syncAxis(null);
            cAxis.setTickDensity(20);

            if (chartIndex == 1) {
                // Speicify a color gradient as a list of colors, and use it in the color axis.
                int[] colorGradient = {0x0044cc, 0xffffff, 0x00aa00};
                cAxis.setColorGradient(false, colorGradient);
            } else if (chartIndex == 2) {
                // Specify the color scale to use in the color axis
                double[] colorScale = {-1.0, 0x1a9850, -0.75, 0x66bd63, -0.5, 0xa6d96a, -0.25,
                    0xd9ef8b, 0, 0xfee08b, 0.25, 0xfdae61, 0.5, 0xf46d43, 0.75, 0xd73027, 1};
                cAxis.setColorScale(colorScale);
            } else if (chartIndex == 3) {
                // Specify the color scale to use in the color axis. Also specify an underflow color
                // 0x66ccff (blue) for regions that fall below the lower axis limit.
                double[] colorScale = {0, 0xffff99, 0.2, 0x80cdc1, 0.4, 0x35978f, 0.6, 0x01665e,
                    0.8, 0x003c30, 1};
                cAxis.setColorScale(colorScale, 0x66ccff);
            }

            // Set the center of the plot region at (230, 250), and set width x depth x height to
            // 240 x 240 x 170 pixels
            c.setPlotRegion(230, 250, 240, 240, 170);

            // Set the plot region wall thichness to 3 pixels
            c.setWallThickness(3);

            // Set the elevation and rotation angles to 45 degrees
            c.setViewAngle(45, 45);

            // Set the perspective level to 20
            c.setPerspective(20);

            // Spline interpolate data to a 50 x 50 grid for a smooth surface
            c.setInterpolation(50, 50);

            // Set the axis title
            c.xAxis().setTitle("X-Axis", "Arial Bold", 10);
            c.yAxis().setTitle("Y-Axis", "Arial Bold", 10);
            c.zAxis().setTitle("Z Axis", "Arial Bold", 10);

            // Output the chart
            viewer.Chart = c;

            //include tool tip for the chart
            viewer.ImageMap = c.getHTMLImageMap("clickable", "",
                "title='<*cdml*>X: {x|2}<*br*>Y: {y|2}<*br*>Z: {z|2}'");
        }
    }
}
[ASP.NET Web Forms - C# version] NetWebCharts\CSharpASP\surfacecolor.aspx
(Click here on how to convert this code to code-behind style.)<%@ Page Language="C#" Debug="true" %>
<%@ Import Namespace="ChartDirector" %>
<%@ Register TagPrefix="chart" Namespace="ChartDirector" Assembly="netchartdir" %>
<!DOCTYPE html>
<script runat="server">
//
// Create chart
//
protected void createChart(WebChartViewer viewer, int chartIndex)
{
// The x and y coordinates of the grid
double[] dataX = {-4, -3, -2, -1, 0, 1, 2, 3, 4};
double[] dataY = {-4, -3, -2, -1, 0, 1, 2, 3, 4};
// Use random numbers for the z values on the XY grid
RanSeries r = new RanSeries(99);
double[] dataZ = r.get2DSeries(dataX.Length, dataY.Length, -0.9, 0.9);
// Create a SurfaceChart object of size 460 x 460 pixels with white (0xffffff) background and
// grey (0x888888) border
SurfaceChart c = new SurfaceChart(460, 460, 0xffffff, 0x888888);
// Set the surface data
c.setData(dataX, dataY, dataZ);
// Add a color axis (the legend) in at the top center of the chart, with labels at the bottom.
// Set the axis to flat style.
ColorAxis cAxis = c.setColorAxis(c.getWidth() / 2, 15, Chart.Top, 250, Chart.Bottom);
cAxis.setTitle("Color Axis");
cAxis.setAxisBorder(Chart.Transparent, 0);
// By default, the color axis is synchronized with the z-axis. The following code remove the
// synchronization so that the color axis will auto-scale independently. Set the auto-scale
// minimum tick spacing to 20 pixels.
cAxis.syncAxis(null);
cAxis.setTickDensity(20);
if (chartIndex == 1) {
// Speicify a color gradient as a list of colors, and use it in the color axis.
int[] colorGradient = {0x0044cc, 0xffffff, 0x00aa00};
cAxis.setColorGradient(false, colorGradient);
} else if (chartIndex == 2) {
// Specify the color scale to use in the color axis
double[] colorScale = {-1.0, 0x1a9850, -0.75, 0x66bd63, -0.5, 0xa6d96a, -0.25, 0xd9ef8b, 0,
0xfee08b, 0.25, 0xfdae61, 0.5, 0xf46d43, 0.75, 0xd73027, 1};
cAxis.setColorScale(colorScale);
} else if (chartIndex == 3) {
// Specify the color scale to use in the color axis. Also specify an underflow color
// 0x66ccff (blue) for regions that fall below the lower axis limit.
double[] colorScale = {0, 0xffff99, 0.2, 0x80cdc1, 0.4, 0x35978f, 0.6, 0x01665e, 0.8,
0x003c30, 1};
cAxis.setColorScale(colorScale, 0x66ccff);
}
// Set the center of the plot region at (230, 250), and set width x depth x height to 240 x 240
// x 170 pixels
c.setPlotRegion(230, 250, 240, 240, 170);
// Set the plot region wall thichness to 3 pixels
c.setWallThickness(3);
// Set the elevation and rotation angles to 45 degrees
c.setViewAngle(45, 45);
// Set the perspective level to 20
c.setPerspective(20);
// Spline interpolate data to a 50 x 50 grid for a smooth surface
c.setInterpolation(50, 50);
// Set the axis title
c.xAxis().setTitle("X-Axis", "Arial Bold", 10);
c.yAxis().setTitle("Y-Axis", "Arial Bold", 10);
c.zAxis().setTitle("Z Axis", "Arial Bold", 10);
// Output the chart
viewer.Image = c.makeWebImage(Chart.SVG);
}
//
// Page Load event handler
//
protected void Page_Load(object sender, EventArgs e)
{
createChart(WebChartViewer0, 0);
createChart(WebChartViewer1, 1);
createChart(WebChartViewer2, 2);
createChart(WebChartViewer3, 3);
}
</script>
<html>
<head>
<script type="text/javascript" src="cdjcv.js"></script>
</head>
<body>
<chart:WebChartViewer id="WebChartViewer0" runat="server" />
<chart:WebChartViewer id="WebChartViewer1" runat="server" />
<chart:WebChartViewer id="WebChartViewer2" runat="server" />
<chart:WebChartViewer id="WebChartViewer3" runat="server" />
</body>
</html>
[ASP.NET Web Forms - VB Version] NetWebCharts\VBNetASP\surfacecolor.aspx
(Click here on how to convert this code to code-behind style.)<%@ Page Language="VB" Debug="true" %>
<%@ Import Namespace="ChartDirector" %>
<%@ Register TagPrefix="chart" Namespace="ChartDirector" Assembly="netchartdir" %>
<!DOCTYPE html>
<script runat="server">
'
' Create chart
'
Protected Sub createChart(viewer As WebChartViewer, chartIndex As Integer)
' The x and y coordinates of the grid
Dim dataX() As Double = {-4, -3, -2, -1, 0, 1, 2, 3, 4}
Dim dataY() As Double = {-4, -3, -2, -1, 0, 1, 2, 3, 4}
' Use random numbers for the z values on the XY grid
Dim r As RanSeries = New RanSeries(99)
Dim dataZ() As Double = r.get2DSeries(UBound(dataX) + 1, UBound(dataY) + 1, -0.9, 0.9)
' Create a SurfaceChart object of size 460 x 460 pixels with white (0xffffff) background and
' grey (0x888888) border
Dim c As SurfaceChart = New SurfaceChart(460, 460, &Hffffff, &H888888)
' Set the surface data
c.setData(dataX, dataY, dataZ)
' Add a color axis (the legend) in at the top center of the chart, with labels at the bottom.
' Set the axis to flat style.
Dim cAxis As ColorAxis = c.setColorAxis(c.getWidth() \ 2, 15, Chart.Top, 250, Chart.Bottom)
cAxis.setTitle("Color Axis")
cAxis.setAxisBorder(Chart.Transparent, 0)
' By default, the color axis is synchronized with the z-axis. The following code remove the
' synchronization so that the color axis will auto-scale independently. Set the auto-scale
' minimum tick spacing to 20 pixels.
cAxis.syncAxis(Nothing)
cAxis.setTickDensity(20)
If chartIndex = 1 Then
' Speicify a color gradient as a list of colors, and use it in the color axis.
Dim colorGradient() As Integer = {&H0044cc, &Hffffff, &H00aa00}
cAxis.setColorGradient(False, colorGradient)
ElseIf chartIndex = 2 Then
' Specify the color scale to use in the color axis
Dim colorScale() As Double = {-1.0, &H1a9850, -0.75, &H66bd63, -0.5, &Ha6d96a, -0.25, _
&Hd9ef8b, 0, &Hfee08b, 0.25, &Hfdae61, 0.5, &Hf46d43, 0.75, &Hd73027, 1}
cAxis.setColorScale(colorScale)
ElseIf chartIndex = 3 Then
' Specify the color scale to use in the color axis. Also specify an underflow color 0x66ccff
' (blue) for regions that fall below the lower axis limit.
Dim colorScale() As Double = {0, &Hffff99, 0.2, &H80cdc1, 0.4, &H35978f, 0.6, &H01665e, _
0.8, &H003c30, 1}
cAxis.setColorScale(colorScale, &H66ccff)
End If
' Set the center of the plot region at (230, 250), and set width x depth x height to 240 x 240 x
' 170 pixels
c.setPlotRegion(230, 250, 240, 240, 170)
' Set the plot region wall thichness to 3 pixels
c.setWallThickness(3)
' Set the elevation and rotation angles to 45 degrees
c.setViewAngle(45, 45)
' Set the perspective level to 20
c.setPerspective(20)
' Spline interpolate data to a 50 x 50 grid for a smooth surface
c.setInterpolation(50, 50)
' Set the axis title
c.xAxis().setTitle("X-Axis", "Arial Bold", 10)
c.yAxis().setTitle("Y-Axis", "Arial Bold", 10)
c.zAxis().setTitle("Z Axis", "Arial Bold", 10)
' Output the chart
viewer.Image = c.makeWebImage(Chart.SVG)
End Sub
'
' Page Load event handler
'
Protected Sub Page_Load(ByVal sender As System.Object, ByVal e As System.EventArgs)
createChart(WebChartViewer0, 0)
createChart(WebChartViewer1, 1)
createChart(WebChartViewer2, 2)
createChart(WebChartViewer3, 3)
End Sub
</script>
<html>
<head>
<script type="text/javascript" src="cdjcv.js"></script>
</head>
<body>
<chart:WebChartViewer id="WebChartViewer0" runat="server" />
<chart:WebChartViewer id="WebChartViewer1" runat="server" />
<chart:WebChartViewer id="WebChartViewer2" runat="server" />
<chart:WebChartViewer id="WebChartViewer3" runat="server" />
</body>
</html>
[ASP.NET MVC - Controller] NetMvcCharts\Controllers\SurfacecolorController.cs
using System;
using System.Web.Mvc;
using ChartDirector;

namespace NetMvcCharts.Controllers
{
    public class SurfacecolorController : Controller
    {
        //
        // Default Action
        //
        public ActionResult Index()
        {
            ViewBag.Title = "Surface Color Scale";

            // This example contains 4 charts.
            ViewBag.Viewer = new RazorChartViewer[4];
            for (int i = 0; i < ViewBag.Viewer.Length; ++i)
                createChart(ViewBag.Viewer[i] = new RazorChartViewer(HttpContext, "chart" + i), i);

            return View("~/Views/Shared/ChartView.cshtml");
        }

        //
        // Create chart
        //
        private void createChart(RazorChartViewer viewer, int chartIndex)
        {
            // The x and y coordinates of the grid
            double[] dataX = {-4, -3, -2, -1, 0, 1, 2, 3, 4};
            double[] dataY = {-4, -3, -2, -1, 0, 1, 2, 3, 4};

            // Use random numbers for the z values on the XY grid
            RanSeries r = new RanSeries(99);
            double[] dataZ = r.get2DSeries(dataX.Length, dataY.Length, -0.9, 0.9);

            // Create a SurfaceChart object of size 460 x 460 pixels with white (0xffffff) background and
            // grey (0x888888) border
            SurfaceChart c = new SurfaceChart(460, 460, 0xffffff, 0x888888);

            // Set the surface data
            c.setData(dataX, dataY, dataZ);

            // Add a color axis (the legend) in at the top center of the chart, with labels at the
            // bottom. Set the axis to flat style.
            ColorAxis cAxis = c.setColorAxis(c.getWidth() / 2, 15, Chart.Top, 250, Chart.Bottom);
            cAxis.setTitle("Color Axis");
            cAxis.setAxisBorder(Chart.Transparent, 0);

            // By default, the color axis is synchronized with the z-axis. The following code remove the
            // synchronization so that the color axis will auto-scale independently. Set the auto-scale
            // minimum tick spacing to 20 pixels.
            cAxis.syncAxis(null);
            cAxis.setTickDensity(20);

            if (chartIndex == 1) {
                // Speicify a color gradient as a list of colors, and use it in the color axis.
                int[] colorGradient = {0x0044cc, 0xffffff, 0x00aa00};
                cAxis.setColorGradient(false, colorGradient);
            } else if (chartIndex == 2) {
                // Specify the color scale to use in the color axis
                double[] colorScale = {-1.0, 0x1a9850, -0.75, 0x66bd63, -0.5, 0xa6d96a, -0.25, 0xd9ef8b,
                    0, 0xfee08b, 0.25, 0xfdae61, 0.5, 0xf46d43, 0.75, 0xd73027, 1};
                cAxis.setColorScale(colorScale);
            } else if (chartIndex == 3) {
                // Specify the color scale to use in the color axis. Also specify an underflow color
                // 0x66ccff (blue) for regions that fall below the lower axis limit.
                double[] colorScale = {0, 0xffff99, 0.2, 0x80cdc1, 0.4, 0x35978f, 0.6, 0x01665e, 0.8,
                    0x003c30, 1};
                cAxis.setColorScale(colorScale, 0x66ccff);
            }

            // Set the center of the plot region at (230, 250), and set width x depth x height to 240 x
            // 240 x 170 pixels
            c.setPlotRegion(230, 250, 240, 240, 170);

            // Set the plot region wall thichness to 3 pixels
            c.setWallThickness(3);

            // Set the elevation and rotation angles to 45 degrees
            c.setViewAngle(45, 45);

            // Set the perspective level to 20
            c.setPerspective(20);

            // Spline interpolate data to a 50 x 50 grid for a smooth surface
            c.setInterpolation(50, 50);

            // Set the axis title
            c.xAxis().setTitle("X-Axis", "Arial Bold", 10);
            c.yAxis().setTitle("Y-Axis", "Arial Bold", 10);
            c.zAxis().setTitle("Z Axis", "Arial Bold", 10);

            // Output the chart
            viewer.Image = c.makeWebImage(Chart.SVG);
        }
    }
}
[ASP.NET MVC - View] NetMvcCharts\Views\Shared\ChartView.cshtml
@{ Layout = null; }

<!DOCTYPE html>

<html>
<head>
    <meta name="viewport" content="width=device-width" />
    <title>@ViewBag.Title</title>
    <style>
        @ViewBag.Style
    </style>
    @Scripts.Render("~/Scripts/cdjcv.js")
</head>
<body style="margin:5px 0px 0px 5px">
    <div style="font:bold 18pt verdana;">
        @ViewBag.Title
    </div>
    <hr style="border:solid 1px #000080; background:#000080" />
    <div>
        @{
            if (ViewBag.Viewer is Array)
            {
                // Display multiple charts
                for (int i = 0; i < ViewBag.Viewer.Length; ++i)
                {
                    @:@Html.Raw(ViewBag.Viewer[i].RenderHTML())
                }
            }
            else
            {
                // Display one chart only
                @:@Html.Raw(ViewBag.Viewer.RenderHTML())
            }
        }
    </div>
</body>
</html>
© 2023 Advanced Software Engineering Limited. All rights reserved.