[Windows Forms - C# version] NetWinCharts\CSharpWinCharts\surfacetexture.cs
using System;
using ChartDirector;
namespace CSharpChartExplorer
{
public class surfacetexture : DemoModule
{
//Name of demo module
public string getName() { return "Surface Texture"; }
//Number of charts produced in this demo module
public int getNoOfCharts() { return 3; }
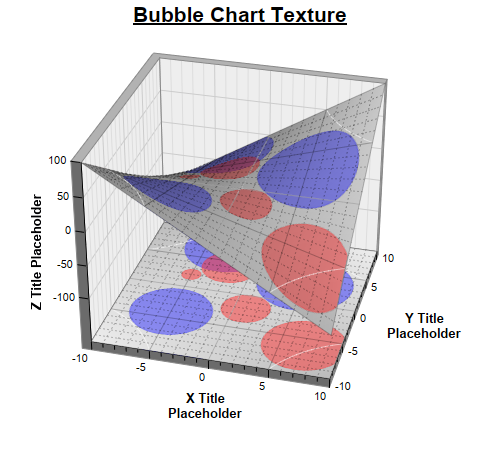
// Use a bubble chart as the surface texture
private void addBubbleTexture(SurfaceChart sc)
{
// Set the original surface color to be from grey (0xbbbbbb) to light grey (0xeeeeee)
// based on the z-value. This will become the background color of the surface.
sc.colorAxis().setColorGradient(true, new int[] {0xbbbbbb, 0xeeeeee});
// The data values for the red bubbles
double[] dataX0 = {-5, -2, 1, 7};
double[] dataY0 = {2, 4, -2, -6};
double[] dataZ0 = {20, 60, 50, 85};
// The data values for the blue bubbles
double[] dataX1 = {5, -5, -3};
double[] dataY1 = {3, -4, 7};
double[] dataZ1 = {100, 85, 95};
// Create a bubble chart of the same size as the surface XY size
XYChart c = new XYChart(sc.getPlotRegionWidth(), sc.getPlotRegionDepth(),
Chart.Transparent);
c.setPlotArea(0, 0, c.getWidth(), c.getHeight(), -1, -1, Chart.Transparent,
Chart.Transparent);
// Synchronize the bubble chart axis scale to the surface axis scale. As the surface
// axes are visible, we can hide the bubble chart axes.
c.yAxis().syncAxis(sc.yAxis());
c.xAxis().syncAxis(sc.xAxis());
c.xAxis().setColors(Chart.Transparent);
c.yAxis().setColors(Chart.Transparent);
// Add bubbles with the semi-transparent red color (0x7fff3333). Also add a matching
// legend entry to the surface chart.
c.addScatterLayer(dataX0, dataY0, "", Chart.CircleSymbol, 9, 0x7fff3333, 0x7fff3333
).setSymbolScale(dataZ0);
sc.getLegend().addKey("Hot Zone", 0x7fff3333);
// Add bubbles with the semi-transparent blue color (0x7f3333ff). Also add a matchine
// legend entry to the surface chart
c.addScatterLayer(dataX1, dataY1, "", Chart.CircleSymbol, 9, 0x7f3333ff, 0x7f3333ff
).setSymbolScale(dataZ1);
sc.getLegend().addKey("Wet Zone", 0x7f3333ff);
// Before we generate the bubble chart as texture, we must layout the surface chart
// first. It is because the bubble chart axis scale depends on the surface chart axis
// scale.
sc.layout();
// Output the bubble chart and save it as a resource
sc.setResource("texture", c.makeChart3());
// Use the resource as the texture
sc.setSurfaceTexture(sc.patternColor("@/texture"));
}
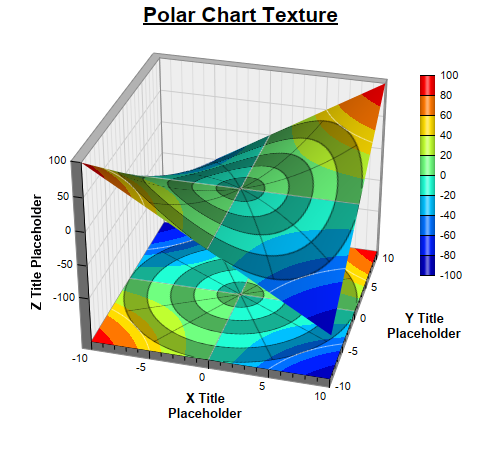
// Use a polar chart as the surface texture
private void addPolarTexture(SurfaceChart sc)
{
sc.setSurfaceAxisGrid(Chart.Transparent, Chart.Transparent);
PolarChart c = new PolarChart(sc.getPlotRegionWidth(), sc.getPlotRegionDepth(),
Chart.Transparent);
c.setPlotArea(c.getWidth() / 2, c.getHeight() / 2, c.getWidth() / 2);
// Use alternative light grey/dark grey circular background color
c.setPlotAreaBg(unchecked((int)0xaf000000), Chart.Transparent);
// Set the grid style to circular grid
c.setGridStyle(false);
// Set angular axis as 0 - 360, with a spoke every 30 units
c.angularAxis().setLinearScale(0, 360, 30);
c.angularAxis().setLabelStyle("normal", 8, Chart.Transparent);
c.radialAxis().setLinearScale(0, 10, 2);
c.radialAxis().setColors(Chart.Transparent, Chart.Transparent);
// Output the polar chart and save it as a resource
sc.setResource("texture", c.makeChart3());
// Use the resource as the texture
sc.setSurfaceTexture(sc.patternColor("@/texture"));
}
//Main code for creating charts
public void createChart(WinChartViewer viewer, int chartIndex)
{
// The x and y coordinates of the grid
double[] dataX = {-10, -9, -8, -7, -6, -5, -4, -3, -2, -1, 0, 1, 2, 3, 4, 5, 6, 7, 8, 9,
10};
double[] dataY = {-10, -9, -8, -7, -6, -5, -4, -3, -2, -1, 0, 1, 2, 3, 4, 5, 6, 7, 8, 9,
10};
// The values at the grid points. In this example, we will compute the values using the
// formula z = x * y.
double[] dataZ = new double[dataX.Length * dataY.Length];
for(int yIndex = 0; yIndex < dataY.Length; ++yIndex) {
for(int xIndex = 0; xIndex < dataX.Length; ++xIndex) {
dataZ[yIndex * dataX.Length + xIndex] = dataX[xIndex] * dataY[yIndex];
}
}
// Create a SurfaceChart object of size 480 x 450 pixels
SurfaceChart c = new SurfaceChart(480, 450);
// Set the center of the plot region at (240, 210), and set width x depth x height to
// 240 x 240 x 200 pixels
c.setPlotRegion(240, 210, 240, 240, 200);
// Set the elevation and rotation angles to 30 and 15 degrees
c.setViewAngle(30, 15);
// Set the data to use to plot the chart
c.setData(dataX, dataY, dataZ);
// Spline interpolate data to a 80 x 80 grid for a smooth surface
c.setInterpolation(80, 80);
// Reserve 50 pixels at the bottom of the z-axis to allow for the XY projection
c.zAxis().setMargin(0, 50);
// Add XY projection
c.addXYProjection();
// Use semi-transparent black (0xc0000000) for x and y major surface grid lines. Use
// dotted style for x and y minor surface grid lines.
int majorGridColor = unchecked((int)0xc0000000);
int minorGridColor = c.dashLineColor(majorGridColor, Chart.DotLine);
c.setSurfaceAxisGrid(majorGridColor, majorGridColor, minorGridColor, minorGridColor);
// Get the surface texture
if (chartIndex == 0) {
// Surface texture is a bubble chart
c.addTitle("<*underline=2*>Bubble Chart Texture", "Arial Bold", 16);
// This texture uses the legend box, so we need to add a legend box to the chart at
// (490, 200).
LegendBox b = c.addLegend(490, 200, true, "Arial Bold", 10);
b.setBackground(Chart.Transparent, Chart.Transparent);
b.setMaxWidth(c.getWidth() - 490 - 1);
// Add the texture
addBubbleTexture(c);
} else if (chartIndex == 1) {
// Surface Texture is a polar chart
c.addTitle("<*underline=2*>Polar Chart Texture", "Arial Bold", 16);
// This texture uses the color axis, so we add the color axis at (420, 75)
ColorAxis cAxis = c.setColorAxis(420, 75, Chart.TopLeft, 200, Chart.Right);
// By default, the color axis synchronizes with the z-axis. We cancel the
// synchronization so that the color axis will auto-scale independently.
cAxis.syncAxis(null);
// Add the texture
addPolarTexture(c);
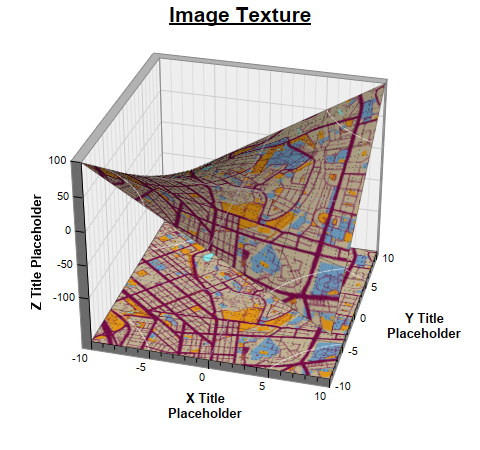
} else {
// Surface Texture is an image
c.addTitle("<*underline=2*>Image Texture", "Arial Bold", 16);
// Use a DrawArea to load the image
DrawArea d = new DrawArea();
// Load image and resize it to fit the plot region
d.load("@/images/maptexture.png");
d.resize(c.getPlotRegionWidth(), c.getPlotRegionDepth());
// Set the DrawArea as a resource
c.setResource("texture", d);
// Use the resource as the texture
c.setSurfaceTexture(c.patternColor("@/texture"));
}
// Set contour lines to semi-transparent white (7fffffff)
c.setContourColor(0x7fffffff);
// Set the x, y and z axis titles using 10 pt Arial Bold font
c.xAxis().setTitle("X Title<*br*>Placeholder", "Arial Bold", 10);
c.yAxis().setTitle("Y Title<*br*>Placeholder", "Arial Bold", 10);
c.zAxis().setTitle("Z Title Placeholder", "Arial Bold", 10);
// Output the chart
viewer.Chart = c;
}
}
}
[Windows Forms - VB Version] NetWinCharts\VBNetWinCharts\surfacetexture.vb
Imports System
Imports Microsoft.VisualBasic
Imports ChartDirector

Public Class surfacetexture
    Implements DemoModule

    'Name of demo module
    Public Function getName() As String Implements DemoModule.getName
        Return "Surface Texture"
    End Function

    'Number of charts produced in this demo module
    Public Function getNoOfCharts() As Integer Implements DemoModule.getNoOfCharts
        Return 3
    End Function

    ' Use a bubble chart as the surface texture
    Private Sub addBubbleTexture(sc As SurfaceChart)

        ' Set the original surface color to be from grey (0xbbbbbb) to light grey (0xeeeeee) based
        ' on the z-value. This will become the background color of the surface.
        sc.colorAxis().setColorGradient(True, New Integer() {&Hbbbbbb, &Heeeeee})

        ' The data values for the red bubbles
        Dim dataX0() As Double = {-5, -2, 1, 7}
        Dim dataY0() As Double = {2, 4, -2, -6}
        Dim dataZ0() As Double = {20, 60, 50, 85}

        ' The data values for the blue bubbles
        Dim dataX1() As Double = {5, -5, -3}
        Dim dataY1() As Double = {3, -4, 7}
        Dim dataZ1() As Double = {100, 85, 95}

        ' Create a bubble chart of the same size as the surface XY size
        Dim c As XYChart = New XYChart(sc.getPlotRegionWidth(), sc.getPlotRegionDepth(), _
            Chart.Transparent)
        c.setPlotArea(0, 0, c.getWidth(), c.getHeight(), -1, -1, Chart.Transparent, _
            Chart.Transparent)

        ' Synchronize the bubble chart axis scale to the surface axis scale. As the surface axes are
        ' visible, we can hide the bubble chart axes.
        c.yAxis().syncAxis(sc.yAxis())
        c.xAxis().syncAxis(sc.xAxis())
        c.xAxis().setColors(Chart.Transparent)
        c.yAxis().setColors(Chart.Transparent)

        ' Add bubbles with the semi-transparent red color (0x7fff3333). Also add a matching legend
        ' entry to the surface chart.
        c.addScatterLayer(dataX0, dataY0, "", Chart.CircleSymbol, 9, &H7fff3333, &H7fff3333 _
            ).setSymbolScale(dataZ0)
        sc.getLegend().addKey("Hot Zone", &H7fff3333)

        ' Add bubbles with the semi-transparent blue color (0x7f3333ff). Also add a matchine legend
        ' entry to the surface chart
        c.addScatterLayer(dataX1, dataY1, "", Chart.CircleSymbol, 9, &H7f3333ff, &H7f3333ff _
            ).setSymbolScale(dataZ1)
        sc.getLegend().addKey("Wet Zone", &H7f3333ff)

        ' Before we generate the bubble chart as texture, we must layout the surface chart first. It
        ' is because the bubble chart axis scale depends on the surface chart axis scale.
        sc.layout()

        ' Output the bubble chart and save it as a resource
        sc.setResource("texture", c.makeChart3())
        ' Use the resource as the texture
        sc.setSurfaceTexture(sc.patternColor("@/texture"))

    End Sub

    ' Use a polar chart as the surface texture
    Private Sub addPolarTexture(sc As SurfaceChart)

        sc.setSurfaceAxisGrid(Chart.Transparent, Chart.Transparent)

        Dim c As PolarChart = New PolarChart(sc.getPlotRegionWidth(), sc.getPlotRegionDepth(), _
            Chart.Transparent)

        c.setPlotArea(c.getWidth() \ 2, c.getHeight() \ 2, c.getWidth() \ 2)

        ' Use alternative light grey/dark grey circular background color
        c.setPlotAreaBg(&Haf000000, Chart.Transparent)

        ' Set the grid style to circular grid
        c.setGridStyle(False)

        ' Set angular axis as 0 - 360, with a spoke every 30 units
        c.angularAxis().setLinearScale(0, 360, 30)
        c.angularAxis().setLabelStyle("normal", 8, Chart.Transparent)
        c.radialAxis().setLinearScale(0, 10, 2)
        c.radialAxis().setColors(Chart.Transparent, Chart.Transparent)

        ' Output the polar chart and save it as a resource
        sc.setResource("texture", c.makeChart3())
        ' Use the resource as the texture
        sc.setSurfaceTexture(sc.patternColor("@/texture"))

    End Sub

    'Main code for creating charts
    Public Sub createChart(viewer As WinChartViewer, chartIndex As Integer) _
        Implements DemoModule.createChart

        ' The x and y coordinates of the grid
        Dim dataX() As Double = {-10, -9, -8, -7, -6, -5, -4, -3, -2, -1, 0, 1, 2, 3, 4, 5, 6, 7, _
            8, 9, 10}
        Dim dataY() As Double = {-10, -9, -8, -7, -6, -5, -4, -3, -2, -1, 0, 1, 2, 3, 4, 5, 6, 7, _
            8, 9, 10}

        ' The values at the grid points. In this example, we will compute the values using the
        ' formula z = x * y.
        Dim dataZ((UBound(dataX) + 1) * (UBound(dataY) + 1) - 1) As Double
        For yIndex As Integer = 0 To UBound(dataY)
            For xIndex As Integer = 0 To UBound(dataX)
                dataZ(yIndex * (UBound(dataX) + 1) + xIndex) = dataX(xIndex) * dataY(yIndex)
            Next
        Next

        ' Create a SurfaceChart object of size 480 x 450 pixels
        Dim c As SurfaceChart = New SurfaceChart(480, 450)

        ' Set the center of the plot region at (240, 210), and set width x depth x height to 240 x
        ' 240 x 200 pixels
        c.setPlotRegion(240, 210, 240, 240, 200)

        ' Set the elevation and rotation angles to 30 and 15 degrees
        c.setViewAngle(30, 15)

        ' Set the data to use to plot the chart
        c.setData(dataX, dataY, dataZ)

        ' Spline interpolate data to a 80 x 80 grid for a smooth surface
        c.setInterpolation(80, 80)

        ' Reserve 50 pixels at the bottom of the z-axis to allow for the XY projection
        c.zAxis().setMargin(0, 50)

        ' Add XY projection
        c.addXYProjection()

        ' Use semi-transparent black (0xc0000000) for x and y major surface grid lines. Use dotted
        ' style for x and y minor surface grid lines.
        Dim majorGridColor As Integer = &Hc0000000
        Dim minorGridColor As Integer = c.dashLineColor(majorGridColor, Chart.DotLine)
        c.setSurfaceAxisGrid(majorGridColor, majorGridColor, minorGridColor, minorGridColor)

        ' Get the surface texture
        If chartIndex = 0 Then
            ' Surface texture is a bubble chart
            c.addTitle("<*underline=2*>Bubble Chart Texture", "Arial Bold", 16)

            ' This texture uses the legend box, so we need to add a legend box to the chart at (490,
            ' 200).
            Dim b As LegendBox = c.addLegend(490, 200, True, "Arial Bold", 10)
            b.setBackground(Chart.Transparent, Chart.Transparent)
            b.setMaxWidth(c.getWidth() - 490 - 1)

            ' Add the texture
            addBubbleTexture(c)
        ElseIf chartIndex = 1 Then
            ' Surface Texture is a polar chart
            c.addTitle("<*underline=2*>Polar Chart Texture", "Arial Bold", 16)

            ' This texture uses the color axis, so we add the color axis at (420, 75)
            Dim cAxis As ColorAxis = c.setColorAxis(420, 75, Chart.TopLeft, 200, Chart.Right)

            ' By default, the color axis synchronizes with the z-axis. We cancel the synchronization
            ' so that the color axis will auto-scale independently.
            cAxis.syncAxis(Nothing)

            ' Add the texture
            addPolarTexture(c)
        Else
            ' Surface Texture is an image
            c.addTitle("<*underline=2*>Image Texture", "Arial Bold", 16)

            ' Use a DrawArea to load the image
            Dim d As DrawArea = New DrawArea()


            ' Load image and resize it to fit the plot region
            d.load("@/maptexture.png")
            d.resize(c.getPlotRegionWidth(), c.getPlotRegionDepth())

            ' Set the DrawArea as a resource
            c.setResource("texture", d)
            ' Use the resource as the texture
            c.setSurfaceTexture(c.patternColor("@/texture"))
        End If

        ' Set contour lines to semi-transparent white (7fffffff)
        c.setContourColor(&H7fffffff)

        ' Set the x, y and z axis titles using 10 pt Arial Bold font
        c.xAxis().setTitle("X Title<*br*>Placeholder", "Arial Bold", 10)
        c.yAxis().setTitle("Y Title<*br*>Placeholder", "Arial Bold", 10)
        c.zAxis().setTitle("Z Title Placeholder", "Arial Bold", 10)

        ' Output the chart
        viewer.Chart = c

    End Sub

End Class
[WPF - C#] NetWPFCharts\CSharpWPFCharts\surfacetexture.cs
using System;
using ChartDirector;

namespace CSharpWPFCharts
{
    public class surfacetexture : DemoModule
    {
        //Name of demo module
        public string getName() { return "Surface Texture"; }

        //Number of charts produced in this demo module
        public int getNoOfCharts() { return 3; }

        // Use a bubble chart as the surface texture
        private void addBubbleTexture(SurfaceChart sc)
        {
            // Set the original surface color to be from grey (0xbbbbbb) to light grey (0xeeeeee)
            // based on the z-value. This will become the background color of the surface.
            sc.colorAxis().setColorGradient(true, new int[] {0xbbbbbb, 0xeeeeee});

            // The data values for the red bubbles
            double[] dataX0 = {-5, -2, 1, 7};
            double[] dataY0 = {2, 4, -2, -6};
            double[] dataZ0 = {20, 60, 50, 85};

            // The data values for the blue bubbles
            double[] dataX1 = {5, -5, -3};
            double[] dataY1 = {3, -4, 7};
            double[] dataZ1 = {100, 85, 95};

            // Create a bubble chart of the same size as the surface XY size
            XYChart c = new XYChart(sc.getPlotRegionWidth(), sc.getPlotRegionDepth(),
                Chart.Transparent);
            c.setPlotArea(0, 0, c.getWidth(), c.getHeight(), -1, -1, Chart.Transparent,
                Chart.Transparent);

            // Synchronize the bubble chart axis scale to the surface axis scale. As the surface
            // axes are visible, we can hide the bubble chart axes.
            c.yAxis().syncAxis(sc.yAxis());
            c.xAxis().syncAxis(sc.xAxis());
            c.xAxis().setColors(Chart.Transparent);
            c.yAxis().setColors(Chart.Transparent);

            // Add bubbles with the semi-transparent red color (0x7fff3333). Also add a matching
            // legend entry to the surface chart.
            c.addScatterLayer(dataX0, dataY0, "", Chart.CircleSymbol, 9, 0x7fff3333, 0x7fff3333
                ).setSymbolScale(dataZ0);
            sc.getLegend().addKey("Hot Zone", 0x7fff3333);

            // Add bubbles with the semi-transparent blue color (0x7f3333ff). Also add a matchine
            // legend entry to the surface chart
            c.addScatterLayer(dataX1, dataY1, "", Chart.CircleSymbol, 9, 0x7f3333ff, 0x7f3333ff
                ).setSymbolScale(dataZ1);
            sc.getLegend().addKey("Wet Zone", 0x7f3333ff);

            // Before we generate the bubble chart as texture, we must layout the surface chart
            // first. It is because the bubble chart axis scale depends on the surface chart axis
            // scale.
            sc.layout();

            // Output the bubble chart and save it as a resource
            sc.setResource("texture", c.makeChart3());
            // Use the resource as the texture
            sc.setSurfaceTexture(sc.patternColor("@/texture"));
        }

        // Use a polar chart as the surface texture
        private void addPolarTexture(SurfaceChart sc)
        {
            sc.setSurfaceAxisGrid(Chart.Transparent, Chart.Transparent);

            PolarChart c = new PolarChart(sc.getPlotRegionWidth(), sc.getPlotRegionDepth(),
                Chart.Transparent);

            c.setPlotArea(c.getWidth() / 2, c.getHeight() / 2, c.getWidth() / 2);

            // Use alternative light grey/dark grey circular background color
            c.setPlotAreaBg(unchecked((int)0xaf000000), Chart.Transparent);

            // Set the grid style to circular grid
            c.setGridStyle(false);

            // Set angular axis as 0 - 360, with a spoke every 30 units
            c.angularAxis().setLinearScale(0, 360, 30);
            c.angularAxis().setLabelStyle("normal", 8, Chart.Transparent);
            c.radialAxis().setLinearScale(0, 10, 2);
            c.radialAxis().setColors(Chart.Transparent, Chart.Transparent);

            // Output the polar chart and save it as a resource
            sc.setResource("texture", c.makeChart3());
            // Use the resource as the texture
            sc.setSurfaceTexture(sc.patternColor("@/texture"));
        }

        //Main code for creating charts
        public void createChart(WPFChartViewer viewer, int chartIndex)
        {
            // The x and y coordinates of the grid
            double[] dataX = {-10, -9, -8, -7, -6, -5, -4, -3, -2, -1, 0, 1, 2, 3, 4, 5, 6, 7, 8, 9,
                10};
            double[] dataY = {-10, -9, -8, -7, -6, -5, -4, -3, -2, -1, 0, 1, 2, 3, 4, 5, 6, 7, 8, 9,
                10};

            // The values at the grid points. In this example, we will compute the values using the
            // formula z = x * y.
            double[] dataZ = new double[dataX.Length * dataY.Length];
            for(int yIndex = 0; yIndex < dataY.Length; ++yIndex) {
                for(int xIndex = 0; xIndex < dataX.Length; ++xIndex) {
                    dataZ[yIndex * dataX.Length + xIndex] = dataX[xIndex] * dataY[yIndex];
                }
            }

            // Create a SurfaceChart object of size 480 x 450 pixels
            SurfaceChart c = new SurfaceChart(480, 450);

            // Set the center of the plot region at (240, 210), and set width x depth x height to
            // 240 x 240 x 200 pixels
            c.setPlotRegion(240, 210, 240, 240, 200);

            // Set the elevation and rotation angles to 30 and 15 degrees
            c.setViewAngle(30, 15);

            // Set the data to use to plot the chart
            c.setData(dataX, dataY, dataZ);

            // Spline interpolate data to a 80 x 80 grid for a smooth surface
            c.setInterpolation(80, 80);

            // Reserve 50 pixels at the bottom of the z-axis to allow for the XY projection
            c.zAxis().setMargin(0, 50);

            // Add XY projection
            c.addXYProjection();

            // Use semi-transparent black (0xc0000000) for x and y major surface grid lines. Use
            // dotted style for x and y minor surface grid lines.
            int majorGridColor = unchecked((int)0xc0000000);
            int minorGridColor = c.dashLineColor(majorGridColor, Chart.DotLine);
            c.setSurfaceAxisGrid(majorGridColor, majorGridColor, minorGridColor, minorGridColor);

            // Get the surface texture
            if (chartIndex == 0) {
                // Surface texture is a bubble chart
                c.addTitle("<*underline=2*>Bubble Chart Texture", "Arial Bold", 16);

                // This texture uses the legend box, so we need to add a legend box to the chart at
                // (490, 200).
                LegendBox b = c.addLegend(490, 200, true, "Arial Bold", 10);
                b.setBackground(Chart.Transparent, Chart.Transparent);
                b.setMaxWidth(c.getWidth() - 490 - 1);

                // Add the texture
                addBubbleTexture(c);
            } else if (chartIndex == 1) {
                // Surface Texture is a polar chart
                c.addTitle("<*underline=2*>Polar Chart Texture", "Arial Bold", 16);

                // This texture uses the color axis, so we add the color axis at (420, 75)
                ColorAxis cAxis = c.setColorAxis(420, 75, Chart.TopLeft, 200, Chart.Right);

                // By default, the color axis synchronizes with the z-axis. We cancel the
                // synchronization so that the color axis will auto-scale independently.
                cAxis.syncAxis(null);

                // Add the texture
                addPolarTexture(c);
            } else {
                // Surface Texture is an image
                c.addTitle("<*underline=2*>Image Texture", "Arial Bold", 16);

                // Use a DrawArea to load the image
                DrawArea d = new DrawArea();


                // Load image and resize it to fit the plot region
                d.load("@/images/maptexture.png");
                d.resize(c.getPlotRegionWidth(), c.getPlotRegionDepth());

                // Set the DrawArea as a resource
                c.setResource("texture", d);
                // Use the resource as the texture
                c.setSurfaceTexture(c.patternColor("@/texture"));
            }

            // Set contour lines to semi-transparent white (7fffffff)
            c.setContourColor(0x7fffffff);

            // Set the x, y and z axis titles using 10 pt Arial Bold font
            c.xAxis().setTitle("X Title<*br*>Placeholder", "Arial Bold", 10);
            c.yAxis().setTitle("Y Title<*br*>Placeholder", "Arial Bold", 10);
            c.zAxis().setTitle("Z Title Placeholder", "Arial Bold", 10);

            // Output the chart
            viewer.Chart = c;
        }
    }
}
[ASP.NET Web Forms - C# version] NetWebCharts\CSharpASP\surfacetexture.aspx
(Click here on how to convert this code to code-behind style.)<%@ Page Language="C#" Debug="true" %>
<%@ Import Namespace="ChartDirector" %>
<%@ Register TagPrefix="chart" Namespace="ChartDirector" Assembly="netchartdir" %>
<!DOCTYPE html>
<script runat="server">
// Use a bubble chart as the surface texture
private void addBubbleTexture(SurfaceChart sc)
{
// Set the original surface color to be from grey (0xbbbbbb) to light grey (0xeeeeee) based on
// the z-value. This will become the background color of the surface.
sc.colorAxis().setColorGradient(true, new int[] {0xbbbbbb, 0xeeeeee});
// The data values for the red bubbles
double[] dataX0 = {-5, -2, 1, 7};
double[] dataY0 = {2, 4, -2, -6};
double[] dataZ0 = {20, 60, 50, 85};
// The data values for the blue bubbles
double[] dataX1 = {5, -5, -3};
double[] dataY1 = {3, -4, 7};
double[] dataZ1 = {100, 85, 95};
// Create a bubble chart of the same size as the surface XY size
XYChart c = new XYChart(sc.getPlotRegionWidth(), sc.getPlotRegionDepth(), Chart.Transparent);
c.setPlotArea(0, 0, c.getWidth(), c.getHeight(), -1, -1, Chart.Transparent, Chart.Transparent);
// Synchronize the bubble chart axis scale to the surface axis scale. As the surface axes are
// visible, we can hide the bubble chart axes.
c.yAxis().syncAxis(sc.yAxis());
c.xAxis().syncAxis(sc.xAxis());
c.xAxis().setColors(Chart.Transparent);
c.yAxis().setColors(Chart.Transparent);
// Add bubbles with the semi-transparent red color (0x7fff3333). Also add a matching legend
// entry to the surface chart.
c.addScatterLayer(dataX0, dataY0, "", Chart.CircleSymbol, 9, 0x7fff3333, 0x7fff3333
).setSymbolScale(dataZ0);
sc.getLegend().addKey("Hot Zone", 0x7fff3333);
// Add bubbles with the semi-transparent blue color (0x7f3333ff). Also add a matchine legend
// entry to the surface chart
c.addScatterLayer(dataX1, dataY1, "", Chart.CircleSymbol, 9, 0x7f3333ff, 0x7f3333ff
).setSymbolScale(dataZ1);
sc.getLegend().addKey("Wet Zone", 0x7f3333ff);
// Before we generate the bubble chart as texture, we must layout the surface chart first. It is
// because the bubble chart axis scale depends on the surface chart axis scale.
sc.layout();
// Output the bubble chart and save it as a resource
sc.setResource("texture", c.makeChart3());
// Use the resource as the texture
sc.setSurfaceTexture(sc.patternColor("@/texture"));
}
// Use a polar chart as the surface texture
private void addPolarTexture(SurfaceChart sc)
{
sc.setSurfaceAxisGrid(Chart.Transparent, Chart.Transparent);
PolarChart c = new PolarChart(sc.getPlotRegionWidth(), sc.getPlotRegionDepth(),
Chart.Transparent);
c.setPlotArea(c.getWidth() / 2, c.getHeight() / 2, c.getWidth() / 2);
// Use alternative light grey/dark grey circular background color
c.setPlotAreaBg(unchecked((int)0xaf000000), Chart.Transparent);
// Set the grid style to circular grid
c.setGridStyle(false);
// Set angular axis as 0 - 360, with a spoke every 30 units
c.angularAxis().setLinearScale(0, 360, 30);
c.angularAxis().setLabelStyle("normal", 8, Chart.Transparent);
c.radialAxis().setLinearScale(0, 10, 2);
c.radialAxis().setColors(Chart.Transparent, Chart.Transparent);
// Output the polar chart and save it as a resource
sc.setResource("texture", c.makeChart3());
// Use the resource as the texture
sc.setSurfaceTexture(sc.patternColor("@/texture"));
}
//
// Create chart
//
protected void createChart(WebChartViewer viewer, int chartIndex)
{
// The x and y coordinates of the grid
double[] dataX = {-10, -9, -8, -7, -6, -5, -4, -3, -2, -1, 0, 1, 2, 3, 4, 5, 6, 7, 8, 9, 10};
double[] dataY = {-10, -9, -8, -7, -6, -5, -4, -3, -2, -1, 0, 1, 2, 3, 4, 5, 6, 7, 8, 9, 10};
// The values at the grid points. In this example, we will compute the values using the formula
// z = x * y.
double[] dataZ = new double[dataX.Length * dataY.Length];
for(int yIndex = 0; yIndex < dataY.Length; ++yIndex) {
for(int xIndex = 0; xIndex < dataX.Length; ++xIndex) {
dataZ[yIndex * dataX.Length + xIndex] = dataX[xIndex] * dataY[yIndex];
}
}
// Create a SurfaceChart object of size 480 x 450 pixels
SurfaceChart c = new SurfaceChart(480, 450);
// Set the center of the plot region at (240, 210), and set width x depth x height to 240 x 240
// x 200 pixels
c.setPlotRegion(240, 210, 240, 240, 200);
// Set the elevation and rotation angles to 30 and 15 degrees
c.setViewAngle(30, 15);
// Set the data to use to plot the chart
c.setData(dataX, dataY, dataZ);
// Spline interpolate data to a 80 x 80 grid for a smooth surface
c.setInterpolation(80, 80);
// Reserve 50 pixels at the bottom of the z-axis to allow for the XY projection
c.zAxis().setMargin(0, 50);
// Add XY projection
c.addXYProjection();
// Use semi-transparent black (0xc0000000) for x and y major surface grid lines. Use dotted
// style for x and y minor surface grid lines.
int majorGridColor = unchecked((int)0xc0000000);
int minorGridColor = c.dashLineColor(majorGridColor, Chart.DotLine);
c.setSurfaceAxisGrid(majorGridColor, majorGridColor, minorGridColor, minorGridColor);
// Get the surface texture
if (chartIndex == 0) {
// Surface texture is a bubble chart
c.addTitle("<*underline=2*>Bubble Chart Texture", "Arial Bold", 16);
// This texture uses the legend box, so we need to add a legend box to the chart at (490,
// 200).
LegendBox b = c.addLegend(490, 200, true, "Arial Bold", 10);
b.setBackground(Chart.Transparent, Chart.Transparent);
b.setMaxWidth(c.getWidth() - 490 - 1);
// Add the texture
addBubbleTexture(c);
} else if (chartIndex == 1) {
// Surface Texture is a polar chart
c.addTitle("<*underline=2*>Polar Chart Texture", "Arial Bold", 16);
// This texture uses the color axis, so we add the color axis at (420, 75)
ColorAxis cAxis = c.setColorAxis(420, 75, Chart.TopLeft, 200, Chart.Right);
// By default, the color axis synchronizes with the z-axis. We cancel the synchronization so
// that the color axis will auto-scale independently.
cAxis.syncAxis(null);
// Add the texture
addPolarTexture(c);
} else {
// Surface Texture is an image
c.addTitle("<*underline=2*>Image Texture", "Arial Bold", 16);
// Use a DrawArea to load the image
DrawArea d = new DrawArea();
//Set default directory for loading images from current script directory
d.setSearchPath(Server.MapPath("."));
// Load image and resize it to fit the plot region
d.load("maptexture.png");
d.resize(c.getPlotRegionWidth(), c.getPlotRegionDepth());
// Set the DrawArea as a resource
c.setResource("texture", d);
// Use the resource as the texture
c.setSurfaceTexture(c.patternColor("@/texture"));
}
// Set contour lines to semi-transparent white (7fffffff)
c.setContourColor(0x7fffffff);
// Set the x, y and z axis titles using 10 pt Arial Bold font
c.xAxis().setTitle("X Title<*br*>Placeholder", "Arial Bold", 10);
c.yAxis().setTitle("Y Title<*br*>Placeholder", "Arial Bold", 10);
c.zAxis().setTitle("Z Title Placeholder", "Arial Bold", 10);
// Output the chart
viewer.Image = c.makeWebImage(Chart.SVG);
}
//
// Page Load event handler
//
protected void Page_Load(object sender, EventArgs e)
{
createChart(WebChartViewer0, 0);
createChart(WebChartViewer1, 1);
createChart(WebChartViewer2, 2);
}
</script>
<html>
<head>
<script type="text/javascript" src="cdjcv.js"></script>
</head>
<body>
<chart:WebChartViewer id="WebChartViewer0" runat="server" />
<chart:WebChartViewer id="WebChartViewer1" runat="server" />
<chart:WebChartViewer id="WebChartViewer2" runat="server" />
</body>
</html>
[ASP.NET Web Forms - VB Version] NetWebCharts\VBNetASP\surfacetexture.aspx
(Click here on how to convert this code to code-behind style.)<%@ Page Language="VB" Debug="true" %>
<%@ Import Namespace="ChartDirector" %>
<%@ Register TagPrefix="chart" Namespace="ChartDirector" Assembly="netchartdir" %>
<!DOCTYPE html>
<script runat="server">
' Use a bubble chart as the surface texture
Private Sub addBubbleTexture(sc As SurfaceChart)
' Set the original surface color to be from grey (0xbbbbbb) to light grey (0xeeeeee) based on
' the z-value. This will become the background color of the surface.
sc.colorAxis().setColorGradient(True, New Integer() {&Hbbbbbb, &Heeeeee})
' The data values for the red bubbles
Dim dataX0() As Double = {-5, -2, 1, 7}
Dim dataY0() As Double = {2, 4, -2, -6}
Dim dataZ0() As Double = {20, 60, 50, 85}
' The data values for the blue bubbles
Dim dataX1() As Double = {5, -5, -3}
Dim dataY1() As Double = {3, -4, 7}
Dim dataZ1() As Double = {100, 85, 95}
' Create a bubble chart of the same size as the surface XY size
Dim c As XYChart = New XYChart(sc.getPlotRegionWidth(), sc.getPlotRegionDepth(), _
Chart.Transparent)
c.setPlotArea(0, 0, c.getWidth(), c.getHeight(), -1, -1, Chart.Transparent, Chart.Transparent)
' Synchronize the bubble chart axis scale to the surface axis scale. As the surface axes are
' visible, we can hide the bubble chart axes.
c.yAxis().syncAxis(sc.yAxis())
c.xAxis().syncAxis(sc.xAxis())
c.xAxis().setColors(Chart.Transparent)
c.yAxis().setColors(Chart.Transparent)
' Add bubbles with the semi-transparent red color (0x7fff3333). Also add a matching legend entry
' to the surface chart.
c.addScatterLayer(dataX0, dataY0, "", Chart.CircleSymbol, 9, &H7fff3333, &H7fff3333 _
).setSymbolScale(dataZ0)
sc.getLegend().addKey("Hot Zone", &H7fff3333)
' Add bubbles with the semi-transparent blue color (0x7f3333ff). Also add a matchine legend
' entry to the surface chart
c.addScatterLayer(dataX1, dataY1, "", Chart.CircleSymbol, 9, &H7f3333ff, &H7f3333ff _
).setSymbolScale(dataZ1)
sc.getLegend().addKey("Wet Zone", &H7f3333ff)
' Before we generate the bubble chart as texture, we must layout the surface chart first. It is
' because the bubble chart axis scale depends on the surface chart axis scale.
sc.layout()
' Output the bubble chart and save it as a resource
sc.setResource("texture", c.makeChart3())
' Use the resource as the texture
sc.setSurfaceTexture(sc.patternColor("@/texture"))
End Sub
' Use a polar chart as the surface texture
Private Sub addPolarTexture(sc As SurfaceChart)
sc.setSurfaceAxisGrid(Chart.Transparent, Chart.Transparent)
Dim c As PolarChart = New PolarChart(sc.getPlotRegionWidth(), sc.getPlotRegionDepth(), _
Chart.Transparent)
c.setPlotArea(c.getWidth() \ 2, c.getHeight() \ 2, c.getWidth() \ 2)
' Use alternative light grey/dark grey circular background color
c.setPlotAreaBg(&Haf000000, Chart.Transparent)
' Set the grid style to circular grid
c.setGridStyle(False)
' Set angular axis as 0 - 360, with a spoke every 30 units
c.angularAxis().setLinearScale(0, 360, 30)
c.angularAxis().setLabelStyle("normal", 8, Chart.Transparent)
c.radialAxis().setLinearScale(0, 10, 2)
c.radialAxis().setColors(Chart.Transparent, Chart.Transparent)
' Output the polar chart and save it as a resource
sc.setResource("texture", c.makeChart3())
' Use the resource as the texture
sc.setSurfaceTexture(sc.patternColor("@/texture"))
End Sub
'
' Create chart
'
Protected Sub createChart(viewer As WebChartViewer, chartIndex As Integer)
' The x and y coordinates of the grid
Dim dataX() As Double = {-10, -9, -8, -7, -6, -5, -4, -3, -2, -1, 0, 1, 2, 3, 4, 5, 6, 7, 8, _
9, 10}
Dim dataY() As Double = {-10, -9, -8, -7, -6, -5, -4, -3, -2, -1, 0, 1, 2, 3, 4, 5, 6, 7, 8, _
9, 10}
' The values at the grid points. In this example, we will compute the values using the formula z
' = x * y.
Dim dataZ((UBound(dataX) + 1) * (UBound(dataY) + 1) - 1) As Double
For yIndex As Integer = 0 To UBound(dataY)
For xIndex As Integer = 0 To UBound(dataX)
dataZ(yIndex * (UBound(dataX) + 1) + xIndex) = dataX(xIndex) * dataY(yIndex)
Next
Next
' Create a SurfaceChart object of size 480 x 450 pixels
Dim c As SurfaceChart = New SurfaceChart(480, 450)
' Set the center of the plot region at (240, 210), and set width x depth x height to 240 x 240 x
' 200 pixels
c.setPlotRegion(240, 210, 240, 240, 200)
' Set the elevation and rotation angles to 30 and 15 degrees
c.setViewAngle(30, 15)
' Set the data to use to plot the chart
c.setData(dataX, dataY, dataZ)
' Spline interpolate data to a 80 x 80 grid for a smooth surface
c.setInterpolation(80, 80)
' Reserve 50 pixels at the bottom of the z-axis to allow for the XY projection
c.zAxis().setMargin(0, 50)
' Add XY projection
c.addXYProjection()
' Use semi-transparent black (0xc0000000) for x and y major surface grid lines. Use dotted style
' for x and y minor surface grid lines.
Dim majorGridColor As Integer = &Hc0000000
Dim minorGridColor As Integer = c.dashLineColor(majorGridColor, Chart.DotLine)
c.setSurfaceAxisGrid(majorGridColor, majorGridColor, minorGridColor, minorGridColor)
' Get the surface texture
If chartIndex = 0 Then
' Surface texture is a bubble chart
c.addTitle("<*underline=2*>Bubble Chart Texture", "Arial Bold", 16)
' This texture uses the legend box, so we need to add a legend box to the chart at (490,
' 200).
Dim b As LegendBox = c.addLegend(490, 200, True, "Arial Bold", 10)
b.setBackground(Chart.Transparent, Chart.Transparent)
b.setMaxWidth(c.getWidth() - 490 - 1)
' Add the texture
addBubbleTexture(c)
ElseIf chartIndex = 1 Then
' Surface Texture is a polar chart
c.addTitle("<*underline=2*>Polar Chart Texture", "Arial Bold", 16)
' This texture uses the color axis, so we add the color axis at (420, 75)
Dim cAxis As ColorAxis = c.setColorAxis(420, 75, Chart.TopLeft, 200, Chart.Right)
' By default, the color axis synchronizes with the z-axis. We cancel the synchronization so
' that the color axis will auto-scale independently.
cAxis.syncAxis(Nothing)
' Add the texture
addPolarTexture(c)
Else
' Surface Texture is an image
c.addTitle("<*underline=2*>Image Texture", "Arial Bold", 16)
' Use a DrawArea to load the image
Dim d As DrawArea = New DrawArea()
' Set default directory for loading images from current script directory
Call d.setSearchPath(Server.MapPath("."))
' Load image and resize it to fit the plot region
d.load("maptexture.png")
d.resize(c.getPlotRegionWidth(), c.getPlotRegionDepth())
' Set the DrawArea as a resource
c.setResource("texture", d)
' Use the resource as the texture
c.setSurfaceTexture(c.patternColor("@/texture"))
End If
' Set contour lines to semi-transparent white (7fffffff)
c.setContourColor(&H7fffffff)
' Set the x, y and z axis titles using 10 pt Arial Bold font
c.xAxis().setTitle("X Title<*br*>Placeholder", "Arial Bold", 10)
c.yAxis().setTitle("Y Title<*br*>Placeholder", "Arial Bold", 10)
c.zAxis().setTitle("Z Title Placeholder", "Arial Bold", 10)
' Output the chart
viewer.Image = c.makeWebImage(Chart.SVG)
End Sub
'
' Page Load event handler
'
Protected Sub Page_Load(ByVal sender As System.Object, ByVal e As System.EventArgs)
createChart(WebChartViewer0, 0)
createChart(WebChartViewer1, 1)
createChart(WebChartViewer2, 2)
End Sub
</script>
<html>
<head>
<script type="text/javascript" src="cdjcv.js"></script>
</head>
<body>
<chart:WebChartViewer id="WebChartViewer0" runat="server" />
<chart:WebChartViewer id="WebChartViewer1" runat="server" />
<chart:WebChartViewer id="WebChartViewer2" runat="server" />
</body>
</html>
[ASP.NET MVC - Controller] NetMvcCharts\Controllers\SurfacetextureController.cs
using System;
using System.Web.Mvc;
using ChartDirector;

namespace NetMvcCharts.Controllers
{
    public class SurfacetextureController : Controller
    {
        // Use a bubble chart as the surface texture
        private void addBubbleTexture(SurfaceChart sc)
        {
            // Set the original surface color to be from grey (0xbbbbbb) to light grey (0xeeeeee) based
            // on the z-value. This will become the background color of the surface.
            sc.colorAxis().setColorGradient(true, new int[] {0xbbbbbb, 0xeeeeee});

            // The data values for the red bubbles
            double[] dataX0 = {-5, -2, 1, 7};
            double[] dataY0 = {2, 4, -2, -6};
            double[] dataZ0 = {20, 60, 50, 85};

            // The data values for the blue bubbles
            double[] dataX1 = {5, -5, -3};
            double[] dataY1 = {3, -4, 7};
            double[] dataZ1 = {100, 85, 95};

            // Create a bubble chart of the same size as the surface XY size
            XYChart c = new XYChart(sc.getPlotRegionWidth(), sc.getPlotRegionDepth(), Chart.Transparent);
            c.setPlotArea(0, 0, c.getWidth(), c.getHeight(), -1, -1, Chart.Transparent, Chart.Transparent
                );

            // Synchronize the bubble chart axis scale to the surface axis scale. As the surface axes are
            // visible, we can hide the bubble chart axes.
            c.yAxis().syncAxis(sc.yAxis());
            c.xAxis().syncAxis(sc.xAxis());
            c.xAxis().setColors(Chart.Transparent);
            c.yAxis().setColors(Chart.Transparent);

            // Add bubbles with the semi-transparent red color (0x7fff3333). Also add a matching legend
            // entry to the surface chart.
            c.addScatterLayer(dataX0, dataY0, "", Chart.CircleSymbol, 9, 0x7fff3333, 0x7fff3333
                ).setSymbolScale(dataZ0);
            sc.getLegend().addKey("Hot Zone", 0x7fff3333);

            // Add bubbles with the semi-transparent blue color (0x7f3333ff). Also add a matchine legend
            // entry to the surface chart
            c.addScatterLayer(dataX1, dataY1, "", Chart.CircleSymbol, 9, 0x7f3333ff, 0x7f3333ff
                ).setSymbolScale(dataZ1);
            sc.getLegend().addKey("Wet Zone", 0x7f3333ff);

            // Before we generate the bubble chart as texture, we must layout the surface chart first. It
            // is because the bubble chart axis scale depends on the surface chart axis scale.
            sc.layout();

            // Output the bubble chart and save it as a resource
            sc.setResource("texture", c.makeChart3());
            // Use the resource as the texture
            sc.setSurfaceTexture(sc.patternColor("@/texture"));
        }

        // Use a polar chart as the surface texture
        private void addPolarTexture(SurfaceChart sc)
        {
            sc.setSurfaceAxisGrid(Chart.Transparent, Chart.Transparent);

            PolarChart c = new PolarChart(sc.getPlotRegionWidth(), sc.getPlotRegionDepth(),
                Chart.Transparent);

            c.setPlotArea(c.getWidth() / 2, c.getHeight() / 2, c.getWidth() / 2);

            // Use alternative light grey/dark grey circular background color
            c.setPlotAreaBg(unchecked((int)0xaf000000), Chart.Transparent);

            // Set the grid style to circular grid
            c.setGridStyle(false);

            // Set angular axis as 0 - 360, with a spoke every 30 units
            c.angularAxis().setLinearScale(0, 360, 30);
            c.angularAxis().setLabelStyle("normal", 8, Chart.Transparent);
            c.radialAxis().setLinearScale(0, 10, 2);
            c.radialAxis().setColors(Chart.Transparent, Chart.Transparent);

            // Output the polar chart and save it as a resource
            sc.setResource("texture", c.makeChart3());
            // Use the resource as the texture
            sc.setSurfaceTexture(sc.patternColor("@/texture"));
        }


        //
        // Default Action
        //
        public ActionResult Index()
        {
            ViewBag.Title = "Surface Texture";

            // This example contains 3 charts.
            ViewBag.Viewer = new RazorChartViewer[3];
            for (int i = 0; i < ViewBag.Viewer.Length; ++i)
                createChart(ViewBag.Viewer[i] = new RazorChartViewer(HttpContext, "chart" + i), i);

            return View("~/Views/Shared/ChartView.cshtml");
        }

        //
        // Create chart
        //
        private void createChart(RazorChartViewer viewer, int chartIndex)
        {
            // The x and y coordinates of the grid
            double[] dataX = {-10, -9, -8, -7, -6, -5, -4, -3, -2, -1, 0, 1, 2, 3, 4, 5, 6, 7, 8, 9, 10};
            double[] dataY = {-10, -9, -8, -7, -6, -5, -4, -3, -2, -1, 0, 1, 2, 3, 4, 5, 6, 7, 8, 9, 10};

            // The values at the grid points. In this example, we will compute the values using the
            // formula z = x * y.
            double[] dataZ = new double[dataX.Length * dataY.Length];
            for(int yIndex = 0; yIndex < dataY.Length; ++yIndex) {
                for(int xIndex = 0; xIndex < dataX.Length; ++xIndex) {
                    dataZ[yIndex * dataX.Length + xIndex] = dataX[xIndex] * dataY[yIndex];
                }
            }

            // Create a SurfaceChart object of size 480 x 450 pixels
            SurfaceChart c = new SurfaceChart(480, 450);

            // Set the center of the plot region at (240, 210), and set width x depth x height to 240 x
            // 240 x 200 pixels
            c.setPlotRegion(240, 210, 240, 240, 200);

            // Set the elevation and rotation angles to 30 and 15 degrees
            c.setViewAngle(30, 15);

            // Set the data to use to plot the chart
            c.setData(dataX, dataY, dataZ);

            // Spline interpolate data to a 80 x 80 grid for a smooth surface
            c.setInterpolation(80, 80);

            // Reserve 50 pixels at the bottom of the z-axis to allow for the XY projection
            c.zAxis().setMargin(0, 50);

            // Add XY projection
            c.addXYProjection();

            // Use semi-transparent black (0xc0000000) for x and y major surface grid lines. Use dotted
            // style for x and y minor surface grid lines.
            int majorGridColor = unchecked((int)0xc0000000);
            int minorGridColor = c.dashLineColor(majorGridColor, Chart.DotLine);
            c.setSurfaceAxisGrid(majorGridColor, majorGridColor, minorGridColor, minorGridColor);

            // Get the surface texture
            if (chartIndex == 0) {
                // Surface texture is a bubble chart
                c.addTitle("<*underline=2*>Bubble Chart Texture", "Arial Bold", 16);

                // This texture uses the legend box, so we need to add a legend box to the chart at (490,
                // 200).
                LegendBox b = c.addLegend(490, 200, true, "Arial Bold", 10);
                b.setBackground(Chart.Transparent, Chart.Transparent);
                b.setMaxWidth(c.getWidth() - 490 - 1);

                // Add the texture
                addBubbleTexture(c);
            } else if (chartIndex == 1) {
                // Surface Texture is a polar chart
                c.addTitle("<*underline=2*>Polar Chart Texture", "Arial Bold", 16);

                // This texture uses the color axis, so we add the color axis at (420, 75)
                ColorAxis cAxis = c.setColorAxis(420, 75, Chart.TopLeft, 200, Chart.Right);

                // By default, the color axis synchronizes with the z-axis. We cancel the synchronization
                // so that the color axis will auto-scale independently.
                cAxis.syncAxis(null);

                // Add the texture
                addPolarTexture(c);
            } else {
                // Surface Texture is an image
                c.addTitle("<*underline=2*>Image Texture", "Arial Bold", 16);

                // Use a DrawArea to load the image
                DrawArea d = new DrawArea();

                //Set default directory for loading images
                d.setSearchPath(Url.Content("~/Content"));

                // Load image and resize it to fit the plot region
                d.load("maptexture.png");
                d.resize(c.getPlotRegionWidth(), c.getPlotRegionDepth());

                // Set the DrawArea as a resource
                c.setResource("texture", d);
                // Use the resource as the texture
                c.setSurfaceTexture(c.patternColor("@/texture"));
            }

            // Set contour lines to semi-transparent white (7fffffff)
            c.setContourColor(0x7fffffff);

            // Set the x, y and z axis titles using 10 pt Arial Bold font
            c.xAxis().setTitle("X Title<*br*>Placeholder", "Arial Bold", 10);
            c.yAxis().setTitle("Y Title<*br*>Placeholder", "Arial Bold", 10);
            c.zAxis().setTitle("Z Title Placeholder", "Arial Bold", 10);

            // Output the chart
            viewer.Image = c.makeWebImage(Chart.SVG);
        }
    }
}
[ASP.NET MVC - View] NetMvcCharts\Views\Shared\ChartView.cshtml
@{ Layout = null; }

<!DOCTYPE html>

<html>
<head>
    <meta name="viewport" content="width=device-width" />
    <title>@ViewBag.Title</title>
    <style>
        @ViewBag.Style
    </style>
    @Scripts.Render("~/Scripts/cdjcv.js")
</head>
<body style="margin:5px 0px 0px 5px">
    <div style="font:bold 18pt verdana;">
        @ViewBag.Title
    </div>
    <hr style="border:solid 1px #000080; background:#000080" />
    <div>
        @{
            if (ViewBag.Viewer is Array)
            {
                // Display multiple charts
                for (int i = 0; i < ViewBag.Viewer.Length; ++i)
                {
                    @:@Html.Raw(ViewBag.Viewer[i].RenderHTML())
                }
            }
            else
            {
                // Display one chart only
                @:@Html.Raw(ViewBag.Viewer.RenderHTML())
            }
        }
    </div>
</body>
</html>
© 2023 Advanced Software Engineering Limited. All rights reserved.