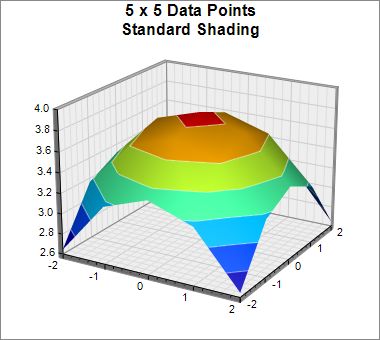
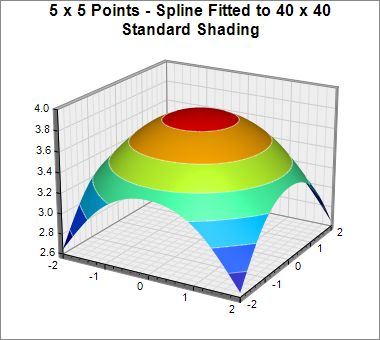
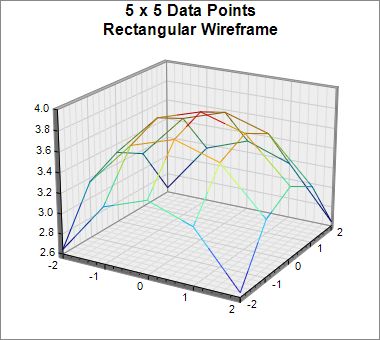
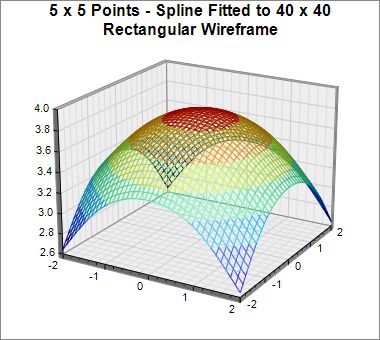
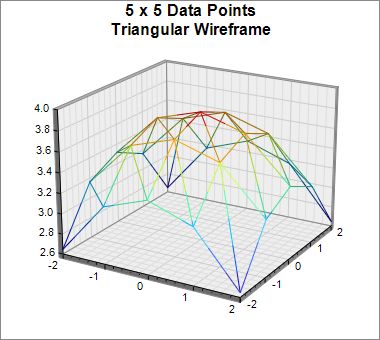
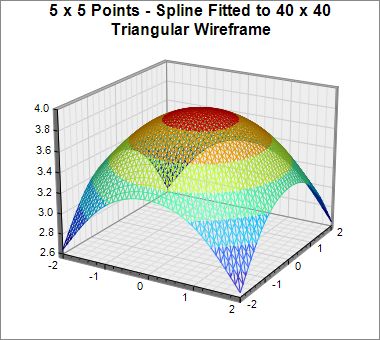
This example demonstrates the rectangular and triangular wireframes of a surface at different interpolation levels, configured using SurfaceChart.setShadingMode and SurfaceChart.setInterpolation.
ChartDirector 7.1 (.NET Edition)
Surface Wireframe
Source Code Listing
using System;
using ChartDirector;

namespace CSharpChartExplorer
{
    public class surfacewireframe : DemoModule
    {
        //Name of demo module
        public string getName() { return "Surface Wireframe"; }

        //Number of charts produced in this demo module
        public int getNoOfCharts() { return 6; }

        //Main code for creating charts
        public void createChart(WinChartViewer viewer, int chartIndex)
        {
            // The x and y coordinates of the grid
            double[] dataX = {-2, -1, 0, 1, 2};
            double[] dataY = {-2, -1, 0, 1, 2};

            // The values at the grid points. In this example, we will compute the values using the
            // formula z = square_root(15 - x * x - y * y).
            double[] dataZ = new double[dataX.Length * dataY.Length];
            for(int yIndex = 0; yIndex < dataY.Length; ++yIndex) {
                double y = dataY[yIndex];
                for(int xIndex = 0; xIndex < dataX.Length; ++xIndex) {
                    double x = dataX[xIndex];
                    dataZ[yIndex * dataX.Length + xIndex] = Math.Sqrt(15 - x * x - y * y);
                }
            }

            // Create a SurfaceChart object of size 380 x 340 pixels, with white (ffffff) background
            // and grey (888888) border.
            SurfaceChart c = new SurfaceChart(380, 340, 0xffffff, 0x888888);

            // Demonstrate various wireframes with and without interpolation
            if (chartIndex == 0) {
                // Original data without interpolation
                c.addTitle("5 x 5 Data Points\nStandard Shading", "Arial Bold", 12);
                c.setContourColor(unchecked((int)0x80ffffff));
            } else if (chartIndex == 1) {
                // Original data, spline interpolated to 40 x 40 for smoothness
                c.addTitle("5 x 5 Points - Spline Fitted to 40 x 40\nStandard Shading",
                    "Arial Bold", 12);
                c.setContourColor(unchecked((int)0x80ffffff));
                c.setInterpolation(40, 40);
            } else if (chartIndex == 2) {
                // Rectangular wireframe of original data
                c.addTitle("5 x 5 Data Points\nRectangular Wireframe");
                c.setShadingMode(Chart.RectangularFrame);
            } else if (chartIndex == 3) {
                // Rectangular wireframe of original data spline interpolated to 40 x 40
                c.addTitle("5 x 5 Points - Spline Fitted to 40 x 40\nRectangular Wireframe");
                c.setShadingMode(Chart.RectangularFrame);
                c.setInterpolation(40, 40);
            } else if (chartIndex == 4) {
                // Triangular wireframe of original data
                c.addTitle("5 x 5 Data Points\nTriangular Wireframe");
                c.setShadingMode(Chart.TriangularFrame);
            } else {
                // Triangular wireframe of original data spline interpolated to 40 x 40
                c.addTitle("5 x 5 Points - Spline Fitted to 40 x 40\nTriangular Wireframe");
                c.setShadingMode(Chart.TriangularFrame);
                c.setInterpolation(40, 40);
            }

            // Set the center of the plot region at (200, 170), and set width x depth x height to
            // 200 x 200 x 150 pixels
            c.setPlotRegion(200, 170, 200, 200, 150);

            // Set the plot region wall thichness to 5 pixels
            c.setWallThickness(5);

            // Set the elevation and rotation angles to 20 and 30 degrees
            c.setViewAngle(20, 30);

            // Set the data to use to plot the chart
            c.setData(dataX, dataY, dataZ);

            // Output the chart
            viewer.Chart = c;
        }
    }
}Imports System
Imports Microsoft.VisualBasic
Imports ChartDirector
Public Class surfacewireframe
Implements DemoModule
'Name of demo module
Public Function getName() As String Implements DemoModule.getName
Return "Surface Wireframe"
End Function
'Number of charts produced in this demo module
Public Function getNoOfCharts() As Integer Implements DemoModule.getNoOfCharts
Return 6
End Function
'Main code for creating charts
Public Sub createChart(viewer As WinChartViewer, chartIndex As Integer) _
Implements DemoModule.createChart
' The x and y coordinates of the grid
Dim dataX() As Double = {-2, -1, 0, 1, 2}
Dim dataY() As Double = {-2, -1, 0, 1, 2}
' The values at the grid points. In this example, we will compute the values using the
' formula z = square_root(15 - x * x - y * y).
Dim dataZ((UBound(dataX) + 1) * (UBound(dataY) + 1) - 1) As Double
For yIndex As Integer = 0 To UBound(dataY)
Dim y As Double = dataY(yIndex)
For xIndex As Integer = 0 To UBound(dataX)
Dim x As Double = dataX(xIndex)
dataZ(yIndex * (UBound(dataX) + 1) + xIndex) = Math.Sqrt(15 - x * x - y * y)
Next
Next
' Create a SurfaceChart object of size 380 x 340 pixels, with white (ffffff) background and
' grey (888888) border.
Dim c As SurfaceChart = New SurfaceChart(380, 340, &Hffffff, &H888888)
' Demonstrate various wireframes with and without interpolation
If chartIndex = 0 Then
' Original data without interpolation
c.addTitle("5 x 5 Data Points<*br*>Standard Shading", "Arial Bold", 12)
c.setContourColor(&H80ffffff)
ElseIf chartIndex = 1 Then
' Original data, spline interpolated to 40 x 40 for smoothness
c.addTitle("5 x 5 Points - Spline Fitted to 40 x 40<*br*>Standard Shading", _
"Arial Bold", 12)
c.setContourColor(&H80ffffff)
c.setInterpolation(40, 40)
ElseIf chartIndex = 2 Then
' Rectangular wireframe of original data
c.addTitle("5 x 5 Data Points<*br*>Rectangular Wireframe")
c.setShadingMode(Chart.RectangularFrame)
ElseIf chartIndex = 3 Then
' Rectangular wireframe of original data spline interpolated to 40 x 40
c.addTitle("5 x 5 Points - Spline Fitted to 40 x 40<*br*>Rectangular Wireframe")
c.setShadingMode(Chart.RectangularFrame)
c.setInterpolation(40, 40)
ElseIf chartIndex = 4 Then
' Triangular wireframe of original data
c.addTitle("5 x 5 Data Points<*br*>Triangular Wireframe")
c.setShadingMode(Chart.TriangularFrame)
Else
' Triangular wireframe of original data spline interpolated to 40 x 40
c.addTitle("5 x 5 Points - Spline Fitted to 40 x 40<*br*>Triangular Wireframe")
c.setShadingMode(Chart.TriangularFrame)
c.setInterpolation(40, 40)
End If
' Set the center of the plot region at (200, 170), and set width x depth x height to 200 x
' 200 x 150 pixels
c.setPlotRegion(200, 170, 200, 200, 150)
' Set the plot region wall thichness to 5 pixels
c.setWallThickness(5)
' Set the elevation and rotation angles to 20 and 30 degrees
c.setViewAngle(20, 30)
' Set the data to use to plot the chart
c.setData(dataX, dataY, dataZ)
' Output the chart
viewer.Chart = c
End Sub
End Classusing System;
using ChartDirector;
namespace CSharpWPFCharts
{
public class surfacewireframe : DemoModule
{
//Name of demo module
public string getName() { return "Surface Wireframe"; }
//Number of charts produced in this demo module
public int getNoOfCharts() { return 6; }
//Main code for creating charts
public void createChart(WPFChartViewer viewer, int chartIndex)
{
// The x and y coordinates of the grid
double[] dataX = {-2, -1, 0, 1, 2};
double[] dataY = {-2, -1, 0, 1, 2};
// The values at the grid points. In this example, we will compute the values using the
// formula z = square_root(15 - x * x - y * y).
double[] dataZ = new double[dataX.Length * dataY.Length];
for(int yIndex = 0; yIndex < dataY.Length; ++yIndex) {
double y = dataY[yIndex];
for(int xIndex = 0; xIndex < dataX.Length; ++xIndex) {
double x = dataX[xIndex];
dataZ[yIndex * dataX.Length + xIndex] = Math.Sqrt(15 - x * x - y * y);
}
}
// Create a SurfaceChart object of size 380 x 340 pixels, with white (ffffff) background
// and grey (888888) border.
SurfaceChart c = new SurfaceChart(380, 340, 0xffffff, 0x888888);
// Demonstrate various wireframes with and without interpolation
if (chartIndex == 0) {
// Original data without interpolation
c.addTitle("5 x 5 Data Points\nStandard Shading", "Arial Bold", 12);
c.setContourColor(unchecked((int)0x80ffffff));
} else if (chartIndex == 1) {
// Original data, spline interpolated to 40 x 40 for smoothness
c.addTitle("5 x 5 Points - Spline Fitted to 40 x 40\nStandard Shading",
"Arial Bold", 12);
c.setContourColor(unchecked((int)0x80ffffff));
c.setInterpolation(40, 40);
} else if (chartIndex == 2) {
// Rectangular wireframe of original data
c.addTitle("5 x 5 Data Points\nRectangular Wireframe");
c.setShadingMode(Chart.RectangularFrame);
} else if (chartIndex == 3) {
// Rectangular wireframe of original data spline interpolated to 40 x 40
c.addTitle("5 x 5 Points - Spline Fitted to 40 x 40\nRectangular Wireframe");
c.setShadingMode(Chart.RectangularFrame);
c.setInterpolation(40, 40);
} else if (chartIndex == 4) {
// Triangular wireframe of original data
c.addTitle("5 x 5 Data Points\nTriangular Wireframe");
c.setShadingMode(Chart.TriangularFrame);
} else {
// Triangular wireframe of original data spline interpolated to 40 x 40
c.addTitle("5 x 5 Points - Spline Fitted to 40 x 40\nTriangular Wireframe");
c.setShadingMode(Chart.TriangularFrame);
c.setInterpolation(40, 40);
}
// Set the center of the plot region at (200, 170), and set width x depth x height to
// 200 x 200 x 150 pixels
c.setPlotRegion(200, 170, 200, 200, 150);
// Set the plot region wall thichness to 5 pixels
c.setWallThickness(5);
// Set the elevation and rotation angles to 20 and 30 degrees
c.setViewAngle(20, 30);
// Set the data to use to plot the chart
c.setData(dataX, dataY, dataZ);
// Output the chart
viewer.Chart = c;
}
}
}<%@ Page Language="C#" Debug="true" %>
<%@ Import Namespace="ChartDirector" %>
<%@ Register TagPrefix="chart" Namespace="ChartDirector" Assembly="netchartdir" %>
<!DOCTYPE html>
<script runat="server">
//
// Create chart
//
protected void createChart(WebChartViewer viewer, int chartIndex)
{
// The x and y coordinates of the grid
double[] dataX = {-2, -1, 0, 1, 2};
double[] dataY = {-2, -1, 0, 1, 2};
// The values at the grid points. In this example, we will compute the values using the formula
// z = square_root(15 - x * x - y * y).
double[] dataZ = new double[dataX.Length * dataY.Length];
for(int yIndex = 0; yIndex < dataY.Length; ++yIndex) {
double y = dataY[yIndex];
for(int xIndex = 0; xIndex < dataX.Length; ++xIndex) {
double x = dataX[xIndex];
dataZ[yIndex * dataX.Length + xIndex] = Math.Sqrt(15 - x * x - y * y);
}
}
// Create a SurfaceChart object of size 380 x 340 pixels, with white (ffffff) background and
// grey (888888) border.
SurfaceChart c = new SurfaceChart(380, 340, 0xffffff, 0x888888);
// Demonstrate various wireframes with and without interpolation
if (chartIndex == 0) {
// Original data without interpolation
c.addTitle("5 x 5 Data Points\nStandard Shading", "Arial Bold", 12);
c.setContourColor(unchecked((int)0x80ffffff));
} else if (chartIndex == 1) {
// Original data, spline interpolated to 40 x 40 for smoothness
c.addTitle("5 x 5 Points - Spline Fitted to 40 x 40\nStandard Shading", "Arial Bold", 12);
c.setContourColor(unchecked((int)0x80ffffff));
c.setInterpolation(40, 40);
} else if (chartIndex == 2) {
// Rectangular wireframe of original data
c.addTitle("5 x 5 Data Points\nRectangular Wireframe");
c.setShadingMode(Chart.RectangularFrame);
} else if (chartIndex == 3) {
// Rectangular wireframe of original data spline interpolated to 40 x 40
c.addTitle("5 x 5 Points - Spline Fitted to 40 x 40\nRectangular Wireframe");
c.setShadingMode(Chart.RectangularFrame);
c.setInterpolation(40, 40);
} else if (chartIndex == 4) {
// Triangular wireframe of original data
c.addTitle("5 x 5 Data Points\nTriangular Wireframe");
c.setShadingMode(Chart.TriangularFrame);
} else {
// Triangular wireframe of original data spline interpolated to 40 x 40
c.addTitle("5 x 5 Points - Spline Fitted to 40 x 40\nTriangular Wireframe");
c.setShadingMode(Chart.TriangularFrame);
c.setInterpolation(40, 40);
}
// Set the center of the plot region at (200, 170), and set width x depth x height to 200 x 200
// x 150 pixels
c.setPlotRegion(200, 170, 200, 200, 150);
// Set the plot region wall thichness to 5 pixels
c.setWallThickness(5);
// Set the elevation and rotation angles to 20 and 30 degrees
c.setViewAngle(20, 30);
// Set the data to use to plot the chart
c.setData(dataX, dataY, dataZ);
// Output the chart
viewer.Image = c.makeWebImage(Chart.SVG);
}
//
// Page Load event handler
//
protected void Page_Load(object sender, EventArgs e)
{
createChart(WebChartViewer0, 0);
createChart(WebChartViewer1, 1);
createChart(WebChartViewer2, 2);
createChart(WebChartViewer3, 3);
createChart(WebChartViewer4, 4);
createChart(WebChartViewer5, 5);
}
</script>
<html>
<head>
<script type="text/javascript" src="cdjcv.js"></script>
</head>
<body>
<chart:WebChartViewer id="WebChartViewer0" runat="server" />
<chart:WebChartViewer id="WebChartViewer1" runat="server" />
<chart:WebChartViewer id="WebChartViewer2" runat="server" />
<chart:WebChartViewer id="WebChartViewer3" runat="server" />
<chart:WebChartViewer id="WebChartViewer4" runat="server" />
<chart:WebChartViewer id="WebChartViewer5" runat="server" />
</body>
</html><%@ Page Language="VB" Debug="true" %>
<%@ Import Namespace="ChartDirector" %>
<%@ Register TagPrefix="chart" Namespace="ChartDirector" Assembly="netchartdir" %>
<!DOCTYPE html>
<script runat="server">
'
' Create chart
'
Protected Sub createChart(viewer As WebChartViewer, chartIndex As Integer)
' The x and y coordinates of the grid
Dim dataX() As Double = {-2, -1, 0, 1, 2}
Dim dataY() As Double = {-2, -1, 0, 1, 2}
' The values at the grid points. In this example, we will compute the values using the formula z
' = square_root(15 - x * x - y * y).
Dim dataZ((UBound(dataX) + 1) * (UBound(dataY) + 1) - 1) As Double
For yIndex As Integer = 0 To UBound(dataY)
Dim y As Double = dataY(yIndex)
For xIndex As Integer = 0 To UBound(dataX)
Dim x As Double = dataX(xIndex)
dataZ(yIndex * (UBound(dataX) + 1) + xIndex) = Math.Sqrt(15 - x * x - y * y)
Next
Next
' Create a SurfaceChart object of size 380 x 340 pixels, with white (ffffff) background and grey
' (888888) border.
Dim c As SurfaceChart = New SurfaceChart(380, 340, &Hffffff, &H888888)
' Demonstrate various wireframes with and without interpolation
If chartIndex = 0 Then
' Original data without interpolation
c.addTitle("5 x 5 Data Points<*br*>Standard Shading", "Arial Bold", 12)
c.setContourColor(&H80ffffff)
ElseIf chartIndex = 1 Then
' Original data, spline interpolated to 40 x 40 for smoothness
c.addTitle("5 x 5 Points - Spline Fitted to 40 x 40<*br*>Standard Shading", "Arial Bold", _
12)
c.setContourColor(&H80ffffff)
c.setInterpolation(40, 40)
ElseIf chartIndex = 2 Then
' Rectangular wireframe of original data
c.addTitle("5 x 5 Data Points<*br*>Rectangular Wireframe")
c.setShadingMode(Chart.RectangularFrame)
ElseIf chartIndex = 3 Then
' Rectangular wireframe of original data spline interpolated to 40 x 40
c.addTitle("5 x 5 Points - Spline Fitted to 40 x 40<*br*>Rectangular Wireframe")
c.setShadingMode(Chart.RectangularFrame)
c.setInterpolation(40, 40)
ElseIf chartIndex = 4 Then
' Triangular wireframe of original data
c.addTitle("5 x 5 Data Points<*br*>Triangular Wireframe")
c.setShadingMode(Chart.TriangularFrame)
Else
' Triangular wireframe of original data spline interpolated to 40 x 40
c.addTitle("5 x 5 Points - Spline Fitted to 40 x 40<*br*>Triangular Wireframe")
c.setShadingMode(Chart.TriangularFrame)
c.setInterpolation(40, 40)
End If
' Set the center of the plot region at (200, 170), and set width x depth x height to 200 x 200 x
' 150 pixels
c.setPlotRegion(200, 170, 200, 200, 150)
' Set the plot region wall thichness to 5 pixels
c.setWallThickness(5)
' Set the elevation and rotation angles to 20 and 30 degrees
c.setViewAngle(20, 30)
' Set the data to use to plot the chart
c.setData(dataX, dataY, dataZ)
' Output the chart
viewer.Image = c.makeWebImage(Chart.SVG)
End Sub
'
' Page Load event handler
'
Protected Sub Page_Load(ByVal sender As System.Object, ByVal e As System.EventArgs)
createChart(WebChartViewer0, 0)
createChart(WebChartViewer1, 1)
createChart(WebChartViewer2, 2)
createChart(WebChartViewer3, 3)
createChart(WebChartViewer4, 4)
createChart(WebChartViewer5, 5)
End Sub
</script>
<html>
<head>
<script type="text/javascript" src="cdjcv.js"></script>
</head>
<body>
<chart:WebChartViewer id="WebChartViewer0" runat="server" />
<chart:WebChartViewer id="WebChartViewer1" runat="server" />
<chart:WebChartViewer id="WebChartViewer2" runat="server" />
<chart:WebChartViewer id="WebChartViewer3" runat="server" />
<chart:WebChartViewer id="WebChartViewer4" runat="server" />
<chart:WebChartViewer id="WebChartViewer5" runat="server" />
</body>
</html>using System;
using System.Web.Mvc;
using ChartDirector;
namespace NetMvcCharts.Controllers
{
public class SurfacewireframeController : Controller
{
//
// Default Action
//
public ActionResult Index()
{
ViewBag.Title = "Surface Wireframe";
// This example contains 6 charts.
ViewBag.Viewer = new RazorChartViewer[6];
for (int i = 0; i < ViewBag.Viewer.Length; ++i)
createChart(ViewBag.Viewer[i] = new RazorChartViewer(HttpContext, "chart" + i), i);
return View("~/Views/Shared/ChartView.cshtml");
}
//
// Create chart
//
private void createChart(RazorChartViewer viewer, int chartIndex)
{
// The x and y coordinates of the grid
double[] dataX = {-2, -1, 0, 1, 2};
double[] dataY = {-2, -1, 0, 1, 2};
// The values at the grid points. In this example, we will compute the values using the
// formula z = square_root(15 - x * x - y * y).
double[] dataZ = new double[dataX.Length * dataY.Length];
for(int yIndex = 0; yIndex < dataY.Length; ++yIndex) {
double y = dataY[yIndex];
for(int xIndex = 0; xIndex < dataX.Length; ++xIndex) {
double x = dataX[xIndex];
dataZ[yIndex * dataX.Length + xIndex] = Math.Sqrt(15 - x * x - y * y);
}
}
// Create a SurfaceChart object of size 380 x 340 pixels, with white (ffffff) background and
// grey (888888) border.
SurfaceChart c = new SurfaceChart(380, 340, 0xffffff, 0x888888);
// Demonstrate various wireframes with and without interpolation
if (chartIndex == 0) {
// Original data without interpolation
c.addTitle("5 x 5 Data Points\nStandard Shading", "Arial Bold", 12);
c.setContourColor(unchecked((int)0x80ffffff));
} else if (chartIndex == 1) {
// Original data, spline interpolated to 40 x 40 for smoothness
c.addTitle("5 x 5 Points - Spline Fitted to 40 x 40\nStandard Shading", "Arial Bold", 12)
;
c.setContourColor(unchecked((int)0x80ffffff));
c.setInterpolation(40, 40);
} else if (chartIndex == 2) {
// Rectangular wireframe of original data
c.addTitle("5 x 5 Data Points\nRectangular Wireframe");
c.setShadingMode(Chart.RectangularFrame);
} else if (chartIndex == 3) {
// Rectangular wireframe of original data spline interpolated to 40 x 40
c.addTitle("5 x 5 Points - Spline Fitted to 40 x 40\nRectangular Wireframe");
c.setShadingMode(Chart.RectangularFrame);
c.setInterpolation(40, 40);
} else if (chartIndex == 4) {
// Triangular wireframe of original data
c.addTitle("5 x 5 Data Points\nTriangular Wireframe");
c.setShadingMode(Chart.TriangularFrame);
} else {
// Triangular wireframe of original data spline interpolated to 40 x 40
c.addTitle("5 x 5 Points - Spline Fitted to 40 x 40\nTriangular Wireframe");
c.setShadingMode(Chart.TriangularFrame);
c.setInterpolation(40, 40);
}
// Set the center of the plot region at (200, 170), and set width x depth x height to 200 x
// 200 x 150 pixels
c.setPlotRegion(200, 170, 200, 200, 150);
// Set the plot region wall thichness to 5 pixels
c.setWallThickness(5);
// Set the elevation and rotation angles to 20 and 30 degrees
c.setViewAngle(20, 30);
// Set the data to use to plot the chart
c.setData(dataX, dataY, dataZ);
// Output the chart
viewer.Image = c.makeWebImage(Chart.SVG);
}
}
}@{ Layout = null; }
<!DOCTYPE html>
<html>
<head>
<meta name="viewport" content="width=device-width" />
<title>@ViewBag.Title</title>
<style>
@ViewBag.Style
</style>
@Scripts.Render("~/Scripts/cdjcv.js")
</head>
<body style="margin:5px 0px 0px 5px">
<div style="font:bold 18pt verdana;">
@ViewBag.Title
</div>
<hr style="border:solid 1px #000080; background:#000080" />
<div>
@{
if (ViewBag.Viewer is Array)
{
// Display multiple charts
for (int i = 0; i < ViewBag.Viewer.Length; ++i)
{
@:@Html.Raw(ViewBag.Viewer[i].RenderHTML())
}
}
else
{
// Display one chart only
@:@Html.Raw(ViewBag.Viewer.RenderHTML())
}
}
</div>
</body>
</html>