[Windows Forms - C# version] NetWinCharts\CSharpWinCharts\threedscatter2.cs
using System;
using ChartDirector;
namespace CSharpChartExplorer
{
public class threedscatter2 : DemoModule
{
//Name of demo module
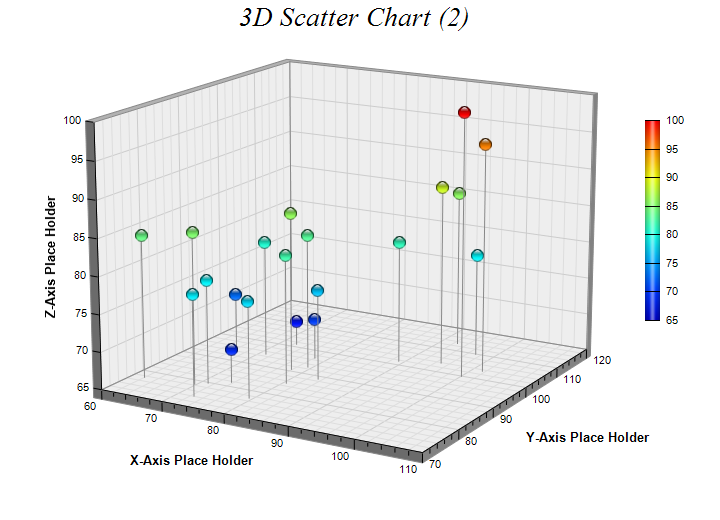
public string getName() { return "3D Scatter Chart (2)"; }
//Number of charts produced in this demo module
public int getNoOfCharts() { return 1; }
//Main code for creating chart.
//Note: the argument chartIndex is unused because this demo only has 1 chart.
public void createChart(WinChartViewer viewer, int chartIndex)
{
// The XYZ data for the 3D scatter chart as 3 random data series
RanSeries r = new RanSeries(3);
double[] xData = r.getSeries2(20, 100, -10, 10);
double[] yData = r.getSeries2(20, 100, -10, 10);
double[] zData = r.getSeries2(20, 100, -10, 10);
// Create a ThreeDScatterChart object of size 720 x 520 pixels
ThreeDScatterChart c = new ThreeDScatterChart(720, 520);
// Add a title to the chart using 20 points Times New Roman Italic font
c.addTitle("3D Scatter Chart (2) ", "Times New Roman Italic", 20);
// Set the center of the plot region at (350, 240), and set width x depth x height to
// 360 x 360 x 270 pixels
c.setPlotRegion(350, 240, 360, 360, 270);
// Set the elevation and rotation angles to 15 and 30 degrees
c.setViewAngle(15, 30);
// Add a scatter group to the chart using 13 pixels glass sphere symbols, in which the
// color depends on the z value of the symbol
ThreeDScatterGroup g = c.addScatterGroup(xData, yData, zData, "",
Chart.GlassSphere2Shape, 13, Chart.SameAsMainColor);
// Add grey (888888) drop lines to the symbols
g.setDropLine(0x888888);
// Add a color axis (the legend) in which the left center is anchored at (645, 220). Set
// the length to 200 pixels and the labels on the right side. Use smooth gradient
// coloring.
c.setColorAxis(645, 220, Chart.Left, 200, Chart.Right).setColorGradient();
// Set the x, y and z axis titles using 10 points Arial Bold font
c.xAxis().setTitle("X-Axis Place Holder", "Arial Bold", 10);
c.yAxis().setTitle("Y-Axis Place Holder", "Arial Bold", 10);
c.zAxis().setTitle("Z-Axis Place Holder", "Arial Bold", 10);
// Output the chart
viewer.Chart = c;
//include tool tip for the chart
viewer.ImageMap = c.getHTMLImageMap("clickable", "",
"title='<*cdml*>x={x|p}, y={y|p}, z={z|p}'");
}
}
}
[Windows Forms - VB Version] NetWinCharts\VBNetWinCharts\threedscatter2.vb
Imports System
Imports Microsoft.VisualBasic
Imports ChartDirector

Public Class threedscatter2
    Implements DemoModule

    'Name of demo module
    Public Function getName() As String Implements DemoModule.getName
        Return "3D Scatter Chart (2)"
    End Function

    'Number of charts produced in this demo module
    Public Function getNoOfCharts() As Integer Implements DemoModule.getNoOfCharts
        Return 1
    End Function

    'Main code for creating chart.
    'Note: the argument chartIndex is unused because this demo only has 1 chart.
    Public Sub createChart(viewer As WinChartViewer, chartIndex As Integer) _
        Implements DemoModule.createChart

        ' The XYZ data for the 3D scatter chart as 3 random data series
        Dim r As RanSeries = New RanSeries(3)
        Dim xData() As Double = r.getSeries2(20, 100, -10, 10)
        Dim yData() As Double = r.getSeries2(20, 100, -10, 10)
        Dim zData() As Double = r.getSeries2(20, 100, -10, 10)

        ' Create a ThreeDScatterChart object of size 720 x 520 pixels
        Dim c As ThreeDScatterChart = New ThreeDScatterChart(720, 520)

        ' Add a title to the chart using 20 points Times New Roman Italic font
        c.addTitle("3D Scatter Chart (2)  ", "Times New Roman Italic", 20)

        ' Set the center of the plot region at (350, 240), and set width x depth x height to 360 x
        ' 360 x 270 pixels
        c.setPlotRegion(350, 240, 360, 360, 270)

        ' Set the elevation and rotation angles to 15 and 30 degrees
        c.setViewAngle(15, 30)

        ' Add a scatter group to the chart using 13 pixels glass sphere symbols, in which the color
        ' depends on the z value of the symbol
        Dim g As ThreeDScatterGroup = c.addScatterGroup(xData, yData, zData, "", _
            Chart.GlassSphere2Shape, 13, Chart.SameAsMainColor)

        ' Add grey (888888) drop lines to the symbols
        g.setDropLine(&H888888)

        ' Add a color axis (the legend) in which the left center is anchored at (645, 220). Set the
        ' length to 200 pixels and the labels on the right side. Use smooth gradient coloring.
        c.setColorAxis(645, 220, Chart.Left, 200, Chart.Right).setColorGradient()

        ' Set the x, y and z axis titles using 10 points Arial Bold font
        c.xAxis().setTitle("X-Axis Place Holder", "Arial Bold", 10)
        c.yAxis().setTitle("Y-Axis Place Holder", "Arial Bold", 10)
        c.zAxis().setTitle("Z-Axis Place Holder", "Arial Bold", 10)

        ' Output the chart
        viewer.Chart = c

        'include tool tip for the chart
        viewer.ImageMap = c.getHTMLImageMap("clickable", "", _
            "title='<*cdml*>x={x|p}, y={y|p}, z={z|p}'")

    End Sub

End Class
[WPF - C#] NetWPFCharts\CSharpWPFCharts\threedscatter2.cs
using System;
using ChartDirector;

namespace CSharpWPFCharts
{
    public class threedscatter2 : DemoModule
    {
        //Name of demo module
        public string getName() { return "3D Scatter Chart (2)"; }

        //Number of charts produced in this demo module
        public int getNoOfCharts() { return 1; }

        //Main code for creating chart.
        //Note: the argument chartIndex is unused because this demo only has 1 chart.
        public void createChart(WPFChartViewer viewer, int chartIndex)
        {
            // The XYZ data for the 3D scatter chart as 3 random data series
            RanSeries r = new RanSeries(3);
            double[] xData = r.getSeries2(20, 100, -10, 10);
            double[] yData = r.getSeries2(20, 100, -10, 10);
            double[] zData = r.getSeries2(20, 100, -10, 10);

            // Create a ThreeDScatterChart object of size 720 x 520 pixels
            ThreeDScatterChart c = new ThreeDScatterChart(720, 520);

            // Add a title to the chart using 20 points Times New Roman Italic font
            c.addTitle("3D Scatter Chart (2)  ", "Times New Roman Italic", 20);

            // Set the center of the plot region at (350, 240), and set width x depth x height to
            // 360 x 360 x 270 pixels
            c.setPlotRegion(350, 240, 360, 360, 270);

            // Set the elevation and rotation angles to 15 and 30 degrees
            c.setViewAngle(15, 30);

            // Add a scatter group to the chart using 13 pixels glass sphere symbols, in which the
            // color depends on the z value of the symbol
            ThreeDScatterGroup g = c.addScatterGroup(xData, yData, zData, "",
                Chart.GlassSphere2Shape, 13, Chart.SameAsMainColor);

            // Add grey (888888) drop lines to the symbols
            g.setDropLine(0x888888);

            // Add a color axis (the legend) in which the left center is anchored at (645, 220). Set
            // the length to 200 pixels and the labels on the right side. Use smooth gradient
            // coloring.
            c.setColorAxis(645, 220, Chart.Left, 200, Chart.Right).setColorGradient();

            // Set the x, y and z axis titles using 10 points Arial Bold font
            c.xAxis().setTitle("X-Axis Place Holder", "Arial Bold", 10);
            c.yAxis().setTitle("Y-Axis Place Holder", "Arial Bold", 10);
            c.zAxis().setTitle("Z-Axis Place Holder", "Arial Bold", 10);

            // Output the chart
            viewer.Chart = c;

            //include tool tip for the chart
            viewer.ImageMap = c.getHTMLImageMap("clickable", "",
                "title='<*cdml*>x={x|p}, y={y|p}, z={z|p}'");
        }
    }
}
[ASP.NET Web Forms - C# version] NetWebCharts\CSharpASP\threedscatter2.aspx
(Click here on how to convert this code to code-behind style.)<%@ Page Language="C#" Debug="true" %>
<%@ Import Namespace="ChartDirector" %>
<%@ Register TagPrefix="chart" Namespace="ChartDirector" Assembly="netchartdir" %>
<!DOCTYPE html>
<script runat="server">
//
// Page Load event handler
//
protected void Page_Load(object sender, EventArgs e)
{
// The XYZ data for the 3D scatter chart as 3 random data series
RanSeries r = new RanSeries(3);
double[] xData = r.getSeries2(20, 100, -10, 10);
double[] yData = r.getSeries2(20, 100, -10, 10);
double[] zData = r.getSeries2(20, 100, -10, 10);
// Create a ThreeDScatterChart object of size 720 x 520 pixels
ThreeDScatterChart c = new ThreeDScatterChart(720, 520);
// Add a title to the chart using 20 points Times New Roman Italic font
c.addTitle("3D Scatter Chart (2) ", "Times New Roman Italic", 20);
// Set the center of the plot region at (350, 240), and set width x depth x height to 360 x 360
// x 270 pixels
c.setPlotRegion(350, 240, 360, 360, 270);
// Set the elevation and rotation angles to 15 and 30 degrees
c.setViewAngle(15, 30);
// Add a scatter group to the chart using 13 pixels glass sphere symbols, in which the color
// depends on the z value of the symbol
ThreeDScatterGroup g = c.addScatterGroup(xData, yData, zData, "", Chart.GlassSphere2Shape, 13,
Chart.SameAsMainColor);
// Add grey (888888) drop lines to the symbols
g.setDropLine(0x888888);
// Add a color axis (the legend) in which the left center is anchored at (645, 220). Set the
// length to 200 pixels and the labels on the right side. Use smooth gradient coloring.
c.setColorAxis(645, 220, Chart.Left, 200, Chart.Right).setColorGradient();
// Set the x, y and z axis titles using 10 points Arial Bold font
c.xAxis().setTitle("X-Axis Place Holder", "Arial Bold", 10);
c.yAxis().setTitle("Y-Axis Place Holder", "Arial Bold", 10);
c.zAxis().setTitle("Z-Axis Place Holder", "Arial Bold", 10);
// Output the chart
WebChartViewer1.Image = c.makeWebImage(Chart.SVG);
// Include tool tip for the chart
WebChartViewer1.ImageMap = c.getHTMLImageMap("", "", "title='<*cdml*>x={x|p}, y={y|p}, z={z|p}'"
);
}
</script>
<html>
<head>
<script type="text/javascript" src="cdjcv.js"></script>
</head>
<body>
<chart:WebChartViewer id="WebChartViewer1" runat="server" />
</body>
</html>
[ASP.NET Web Forms - VB Version] NetWebCharts\VBNetASP\threedscatter2.aspx
(Click here on how to convert this code to code-behind style.)<%@ Page Language="VB" Debug="true" %>
<%@ Import Namespace="ChartDirector" %>
<%@ Register TagPrefix="chart" Namespace="ChartDirector" Assembly="netchartdir" %>
<!DOCTYPE html>
<script runat="server">
'
' Page Load event handler
'
Protected Sub Page_Load(ByVal sender As System.Object, ByVal e As System.EventArgs)
' The XYZ data for the 3D scatter chart as 3 random data series
Dim r As RanSeries = New RanSeries(3)
Dim xData() As Double = r.getSeries2(20, 100, -10, 10)
Dim yData() As Double = r.getSeries2(20, 100, -10, 10)
Dim zData() As Double = r.getSeries2(20, 100, -10, 10)
' Create a ThreeDScatterChart object of size 720 x 520 pixels
Dim c As ThreeDScatterChart = New ThreeDScatterChart(720, 520)
' Add a title to the chart using 20 points Times New Roman Italic font
c.addTitle("3D Scatter Chart (2) ", "Times New Roman Italic", 20)
' Set the center of the plot region at (350, 240), and set width x depth x height to 360 x 360 x
' 270 pixels
c.setPlotRegion(350, 240, 360, 360, 270)
' Set the elevation and rotation angles to 15 and 30 degrees
c.setViewAngle(15, 30)
' Add a scatter group to the chart using 13 pixels glass sphere symbols, in which the color
' depends on the z value of the symbol
Dim g As ThreeDScatterGroup = c.addScatterGroup(xData, yData, zData, "", _
Chart.GlassSphere2Shape, 13, Chart.SameAsMainColor)
' Add grey (888888) drop lines to the symbols
g.setDropLine(&H888888)
' Add a color axis (the legend) in which the left center is anchored at (645, 220). Set the
' length to 200 pixels and the labels on the right side. Use smooth gradient coloring.
c.setColorAxis(645, 220, Chart.Left, 200, Chart.Right).setColorGradient()
' Set the x, y and z axis titles using 10 points Arial Bold font
c.xAxis().setTitle("X-Axis Place Holder", "Arial Bold", 10)
c.yAxis().setTitle("Y-Axis Place Holder", "Arial Bold", 10)
c.zAxis().setTitle("Z-Axis Place Holder", "Arial Bold", 10)
' Output the chart
WebChartViewer1.Image = c.makeWebImage(Chart.SVG)
' Include tool tip for the chart
WebChartViewer1.ImageMap = c.getHTMLImageMap("", "", _
"title='<*cdml*>x={x|p}, y={y|p}, z={z|p}'")
End Sub
</script>
<html>
<head>
<script type="text/javascript" src="cdjcv.js"></script>
</head>
<body>
<chart:WebChartViewer id="WebChartViewer1" runat="server" />
</body>
</html>
[ASP.NET MVC - Controller] NetMvcCharts\Controllers\Threedscatter2Controller.cs
using System;
using System.Web.Mvc;
using ChartDirector;

namespace NetMvcCharts.Controllers
{
    public class Threedscatter2Controller : Controller
    {
        //
        // Default Action
        //
        public ActionResult Index()
        {
            ViewBag.Title = "3D Scatter Chart (2)";
            createChart(ViewBag.Viewer = new RazorChartViewer(HttpContext, "chart1"));
            return View("~/Views/Shared/ChartView.cshtml");
        }

        //
        // Create chart
        //
        private void createChart(RazorChartViewer viewer)
        {
            // The XYZ data for the 3D scatter chart as 3 random data series
            RanSeries r = new RanSeries(3);
            double[] xData = r.getSeries2(20, 100, -10, 10);
            double[] yData = r.getSeries2(20, 100, -10, 10);
            double[] zData = r.getSeries2(20, 100, -10, 10);

            // Create a ThreeDScatterChart object of size 720 x 520 pixels
            ThreeDScatterChart c = new ThreeDScatterChart(720, 520);

            // Add a title to the chart using 20 points Times New Roman Italic font
            c.addTitle("3D Scatter Chart (2)  ", "Times New Roman Italic", 20);

            // Set the center of the plot region at (350, 240), and set width x depth x height to 360 x
            // 360 x 270 pixels
            c.setPlotRegion(350, 240, 360, 360, 270);

            // Set the elevation and rotation angles to 15 and 30 degrees
            c.setViewAngle(15, 30);

            // Add a scatter group to the chart using 13 pixels glass sphere symbols, in which the color
            // depends on the z value of the symbol
            ThreeDScatterGroup g = c.addScatterGroup(xData, yData, zData, "", Chart.GlassSphere2Shape,
                13, Chart.SameAsMainColor);

            // Add grey (888888) drop lines to the symbols
            g.setDropLine(0x888888);

            // Add a color axis (the legend) in which the left center is anchored at (645, 220). Set the
            // length to 200 pixels and the labels on the right side. Use smooth gradient coloring.
            c.setColorAxis(645, 220, Chart.Left, 200, Chart.Right).setColorGradient();

            // Set the x, y and z axis titles using 10 points Arial Bold font
            c.xAxis().setTitle("X-Axis Place Holder", "Arial Bold", 10);
            c.yAxis().setTitle("Y-Axis Place Holder", "Arial Bold", 10);
            c.zAxis().setTitle("Z-Axis Place Holder", "Arial Bold", 10);

            // Output the chart
            viewer.Image = c.makeWebImage(Chart.SVG);

            // Include tool tip for the chart
            viewer.ImageMap = c.getHTMLImageMap("", "",
                "title='<*cdml*>x={x|p}, y={y|p}, z={z|p}'");
        }
    }
}
[ASP.NET MVC - View] NetMvcCharts\Views\Shared\ChartView.cshtml
@{ Layout = null; }

<!DOCTYPE html>

<html>
<head>
    <meta name="viewport" content="width=device-width" />
    <title>@ViewBag.Title</title>
    <style>
        @ViewBag.Style
    </style>
    @Scripts.Render("~/Scripts/cdjcv.js")
</head>
<body style="margin:5px 0px 0px 5px">
    <div style="font:bold 18pt verdana;">
        @ViewBag.Title
    </div>
    <hr style="border:solid 1px #000080; background:#000080" />
    <div>
        @{
            if (ViewBag.Viewer is Array)
            {
                // Display multiple charts
                for (int i = 0; i < ViewBag.Viewer.Length; ++i)
                {
                    @:@Html.Raw(ViewBag.Viewer[i].RenderHTML())
                }
            }
            else
            {
                // Display one chart only
                @:@Html.Raw(ViewBag.Viewer.RenderHTML())
            }
        }
    </div>
</body>
</html>
© 2023 Advanced Software Engineering Limited. All rights reserved.