[Windows Forms - C# version] NetWinCharts\CSharpWinCharts\varwidthbar.cs
using System;
using ChartDirector;
namespace CSharpChartExplorer
{
public class varwidthbar : DemoModule
{
//Name of demo module
public string getName() { return "Variable Width Bar Chart"; }
//Number of charts produced in this demo module
public int getNoOfCharts() { return 1; }
//Main code for creating chart.
//Note: the argument chartIndex is unused because this demo only has 1 chart.
public void createChart(WinChartViewer viewer, int chartIndex)
{
// The data for the chart
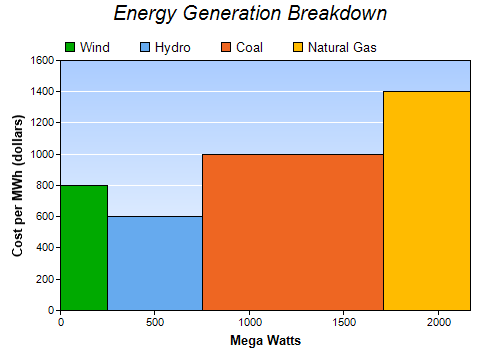
double[] data = {800, 600, 1000, 1400};
double[] widths = {250, 500, 960, 460};
string[] labels = {"Wind", "Hydro", "Coal", "Natural Gas"};
// The colors to use
int[] colors = {0x00aa00, 0x66aaee, 0xee6622, 0xffbb00};
// Create a XYChart object of size 500 x 350 pixels
XYChart c = new XYChart(500, 350);
// Add a title to the chart using 15pt Arial Italic font
c.addTitle("Energy Generation Breakdown", "Arial Italic", 15);
// Set the plotarea at (60, 60) and of (chart_width - 90) x (chart_height - 100) in
// size. Use a vertical gradient color from light blue (f9f9ff) to sky blue (aaccff) as
// background. Set grid lines to white (ffffff).
int plotAreaBgColor = c.linearGradientColor(0, 60, 0, c.getHeight() - 40, 0xaaccff,
0xf9fcff);
c.setPlotArea(60, 60, c.getWidth() - 90, c.getHeight() - 100, plotAreaBgColor, -1, -1,
0xffffff);
// Add a legend box at (50, 30) using horizontal layout and transparent background.
c.addLegend(55, 30, false).setBackground(Chart.Transparent);
// Add titles to x/y axes with 10 points Arial Bold font
c.xAxis().setTitle("Mega Watts", "Arial Bold", 10);
c.yAxis().setTitle("Cost per MWh (dollars)", "Arial Bold", 10);
// Set the x axis rounding to false, so that the x-axis will fit the data exactly
c.xAxis().setRounding(false, false);
// In ChartDirector, there is no bar layer that can have variable bar widths, but you
// may create a bar using an area layer. (A bar can be considered as the area under a
// rectangular outline.) So by using a loop to create one bar per area layer, we can
// achieve a variable width bar chart.
// starting position of current bar
double currentX = 0;
for(int i = 0; i < data.Length; ++i) {
// ending position of current bar
double nextX = currentX + widths[i];
// outline of the bar
double[] dataX = {currentX, currentX, nextX, nextX};
double[] dataY = {0, data[i], data[i], 0};
// create the area layer to fill the bar
AreaLayer layer = c.addAreaLayer(dataY, colors[i], labels[i]);
layer.setXData(dataX);
// Tool tip for the layer
layer.setHTMLImageMap("", "", "title='" + labels[i] + ": " + widths[i] + " MW at $"
+ data[i] + " per MWh'");
// the ending position becomes the starting position of the next bar
currentX = nextX;
}
// Output the chart
viewer.Chart = c;
// Include tool tip for the chart
viewer.ImageMap = c.getHTMLImageMap("clickable");
}
}
}
[Windows Forms - VB Version] NetWinCharts\VBNetWinCharts\varwidthbar.vb
Imports System
Imports Microsoft.VisualBasic
Imports ChartDirector

Public Class varwidthbar
    Implements DemoModule

    'Name of demo module
    Public Function getName() As String Implements DemoModule.getName
        Return "Variable Width Bar Chart"
    End Function

    'Number of charts produced in this demo module
    Public Function getNoOfCharts() As Integer Implements DemoModule.getNoOfCharts
        Return 1
    End Function

    'Main code for creating chart.
    'Note: the argument chartIndex is unused because this demo only has 1 chart.
    Public Sub createChart(viewer As WinChartViewer, chartIndex As Integer) _
        Implements DemoModule.createChart

        ' The data for the chart
        Dim data() As Double = {800, 600, 1000, 1400}
        Dim widths() As Double = {250, 500, 960, 460}
        Dim labels() As String = {"Wind", "Hydro", "Coal", "Natural Gas"}

        ' The colors to use
        Dim colors() As Integer = {&H00aa00, &H66aaee, &Hee6622, &Hffbb00}

        ' Create a XYChart object of size 500 x 350 pixels
        Dim c As XYChart = New XYChart(500, 350)

        ' Add a title to the chart using 15pt Arial Italic font
        c.addTitle("Energy Generation Breakdown", "Arial Italic", 15)

        ' Set the plotarea at (60, 60) and of (chart_width - 90) x (chart_height - 100) in size. Use
        ' a vertical gradient color from light blue (f9f9ff) to sky blue (aaccff) as background. Set
        ' grid lines to white (ffffff).
        Dim plotAreaBgColor As Integer = c.linearGradientColor(0, 60, 0, c.getHeight() - 40, _
            &Haaccff, &Hf9fcff)
        c.setPlotArea(60, 60, c.getWidth() - 90, c.getHeight() - 100, plotAreaBgColor, -1, -1, _
            &Hffffff)

        ' Add a legend box at (50, 30) using horizontal layout and transparent background.
        c.addLegend(55, 30, False).setBackground(Chart.Transparent)

        ' Add titles to x/y axes with 10 points Arial Bold font
        c.xAxis().setTitle("Mega Watts", "Arial Bold", 10)
        c.yAxis().setTitle("Cost per MWh (dollars)", "Arial Bold", 10)

        ' Set the x axis rounding to false, so that the x-axis will fit the data exactly
        c.xAxis().setRounding(False, False)

        ' In ChartDirector, there is no bar layer that can have variable bar widths, but you may
        ' create a bar using an area layer. (A bar can be considered as the area under a rectangular
        ' outline.) So by using a loop to create one bar per area layer, we can achieve a variable
        ' width bar chart.

        ' starting position of current bar
        Dim currentX As Double = 0

        For i As Integer = 0 To UBound(data)
            ' ending position of current bar
            Dim nextX As Double = currentX + widths(i)

            ' outline of the bar
            Dim dataX() As Double = {currentX, currentX, nextX, nextX}
            Dim dataY() As Double = {0, data(i), data(i), 0}

            ' create the area layer to fill the bar
            Dim layer As AreaLayer = c.addAreaLayer(dataY, colors(i), labels(i))
            layer.setXData(dataX)

            ' Tool tip for the layer
            layer.setHTMLImageMap("", "", "title='" & labels(i) & ": " & widths(i) & " MW at $" & _
                data(i) & " per MWh'")

            ' the ending position becomes the starting position of the next bar
            currentX = nextX
        Next

        ' Output the chart
        viewer.Chart = c

        ' Include tool tip for the chart
        viewer.ImageMap = c.getHTMLImageMap("clickable")

    End Sub

End Class
[WPF - C#] NetWPFCharts\CSharpWPFCharts\varwidthbar.cs
using System;
using ChartDirector;

namespace CSharpWPFCharts
{
    public class varwidthbar : DemoModule
    {
        //Name of demo module
        public string getName() { return "Variable Width Bar Chart"; }

        //Number of charts produced in this demo module
        public int getNoOfCharts() { return 1; }

        //Main code for creating chart.
        //Note: the argument chartIndex is unused because this demo only has 1 chart.
        public void createChart(WPFChartViewer viewer, int chartIndex)
        {
            // The data for the chart
            double[] data = {800, 600, 1000, 1400};
            double[] widths = {250, 500, 960, 460};
            string[] labels = {"Wind", "Hydro", "Coal", "Natural Gas"};

            // The colors to use
            int[] colors = {0x00aa00, 0x66aaee, 0xee6622, 0xffbb00};

            // Create a XYChart object of size 500 x 350 pixels
            XYChart c = new XYChart(500, 350);

            // Add a title to the chart using 15pt Arial Italic font
            c.addTitle("Energy Generation Breakdown", "Arial Italic", 15);

            // Set the plotarea at (60, 60) and of (chart_width - 90) x (chart_height - 100) in
            // size. Use a vertical gradient color from light blue (f9f9ff) to sky blue (aaccff) as
            // background. Set grid lines to white (ffffff).
            int plotAreaBgColor = c.linearGradientColor(0, 60, 0, c.getHeight() - 40, 0xaaccff,
                0xf9fcff);
            c.setPlotArea(60, 60, c.getWidth() - 90, c.getHeight() - 100, plotAreaBgColor, -1, -1,
                0xffffff);

            // Add a legend box at (50, 30) using horizontal layout and transparent background.
            c.addLegend(55, 30, false).setBackground(Chart.Transparent);

            // Add titles to x/y axes with 10 points Arial Bold font
            c.xAxis().setTitle("Mega Watts", "Arial Bold", 10);
            c.yAxis().setTitle("Cost per MWh (dollars)", "Arial Bold", 10);

            // Set the x axis rounding to false, so that the x-axis will fit the data exactly
            c.xAxis().setRounding(false, false);

            // In ChartDirector, there is no bar layer that can have variable bar widths, but you
            // may create a bar using an area layer. (A bar can be considered as the area under a
            // rectangular outline.) So by using a loop to create one bar per area layer, we can
            // achieve a variable width bar chart.

            // starting position of current bar
            double currentX = 0;

            for(int i = 0; i < data.Length; ++i) {
                // ending position of current bar
                double nextX = currentX + widths[i];

                // outline of the bar
                double[] dataX = {currentX, currentX, nextX, nextX};
                double[] dataY = {0, data[i], data[i], 0};

                // create the area layer to fill the bar
                AreaLayer layer = c.addAreaLayer(dataY, colors[i], labels[i]);
                layer.setXData(dataX);

                // Tool tip for the layer
                layer.setHTMLImageMap("", "", "title='" + labels[i] + ": " + widths[i] + " MW at $"
                     + data[i] + " per MWh'");

                // the ending position becomes the starting position of the next bar
                currentX = nextX;
            }

            // Output the chart
            viewer.Chart = c;

            // Include tool tip for the chart
            viewer.ImageMap = c.getHTMLImageMap("clickable");
        }
    }
}
[ASP.NET Web Forms - C# version] NetWebCharts\CSharpASP\varwidthbar.aspx
(Click here on how to convert this code to code-behind style.)<%@ Page Language="C#" Debug="true" %>
<%@ Import Namespace="ChartDirector" %>
<%@ Register TagPrefix="chart" Namespace="ChartDirector" Assembly="netchartdir" %>
<!DOCTYPE html>
<script runat="server">
//
// Page Load event handler
//
protected void Page_Load(object sender, EventArgs e)
{
// The data for the chart
double[] data = {800, 600, 1000, 1400};
double[] widths = {250, 500, 960, 460};
string[] labels = {"Wind", "Hydro", "Coal", "Natural Gas"};
// The colors to use
int[] colors = {0x00aa00, 0x66aaee, 0xee6622, 0xffbb00};
// Create a XYChart object of size 500 x 350 pixels
XYChart c = new XYChart(500, 350);
// Add a title to the chart using 15pt Arial Italic font
c.addTitle("Energy Generation Breakdown", "Arial Italic", 15);
// Set the plotarea at (60, 60) and of (chart_width - 90) x (chart_height - 100) in size. Use a
// vertical gradient color from light blue (f9f9ff) to sky blue (aaccff) as background. Set grid
// lines to white (ffffff).
int plotAreaBgColor = c.linearGradientColor(0, 60, 0, c.getHeight() - 40, 0xaaccff, 0xf9fcff);
c.setPlotArea(60, 60, c.getWidth() - 90, c.getHeight() - 100, plotAreaBgColor, -1, -1, 0xffffff)
;
// Add a legend box at (50, 30) using horizontal layout and transparent background.
c.addLegend(55, 30, false).setBackground(Chart.Transparent);
// Add titles to x/y axes with 10 points Arial Bold font
c.xAxis().setTitle("Mega Watts", "Arial Bold", 10);
c.yAxis().setTitle("Cost per MWh (dollars)", "Arial Bold", 10);
// Set the x axis rounding to false, so that the x-axis will fit the data exactly
c.xAxis().setRounding(false, false);
// In ChartDirector, there is no bar layer that can have variable bar widths, but you may create
// a bar using an area layer. (A bar can be considered as the area under a rectangular outline.)
// So by using a loop to create one bar per area layer, we can achieve a variable width bar
// chart.
// starting position of current bar
double currentX = 0;
for(int i = 0; i < data.Length; ++i) {
// ending position of current bar
double nextX = currentX + widths[i];
// outline of the bar
double[] dataX = {currentX, currentX, nextX, nextX};
double[] dataY = {0, data[i], data[i], 0};
// create the area layer to fill the bar
AreaLayer layer = c.addAreaLayer(dataY, colors[i], labels[i]);
layer.setXData(dataX);
// Tool tip for the layer
layer.setHTMLImageMap("", "", "title='" + labels[i] + ": " + widths[i] + " MW at $" + data[i
] + " per MWh'");
// the ending position becomes the starting position of the next bar
currentX = nextX;
}
// Output the chart
WebChartViewer1.Image = c.makeWebImage(Chart.SVG);
// Include tool tip for the chart
WebChartViewer1.ImageMap = c.getHTMLImageMap("");
}
</script>
<html>
<head>
<script type="text/javascript" src="cdjcv.js"></script>
</head>
<body>
<chart:WebChartViewer id="WebChartViewer1" runat="server" />
</body>
</html>
[ASP.NET Web Forms - VB Version] NetWebCharts\VBNetASP\varwidthbar.aspx
(Click here on how to convert this code to code-behind style.)<%@ Page Language="VB" Debug="true" %>
<%@ Import Namespace="ChartDirector" %>
<%@ Register TagPrefix="chart" Namespace="ChartDirector" Assembly="netchartdir" %>
<!DOCTYPE html>
<script runat="server">
'
' Page Load event handler
'
Protected Sub Page_Load(ByVal sender As System.Object, ByVal e As System.EventArgs)
' The data for the chart
Dim data() As Double = {800, 600, 1000, 1400}
Dim widths() As Double = {250, 500, 960, 460}
Dim labels() As String = {"Wind", "Hydro", "Coal", "Natural Gas"}
' The colors to use
Dim colors() As Integer = {&H00aa00, &H66aaee, &Hee6622, &Hffbb00}
' Create a XYChart object of size 500 x 350 pixels
Dim c As XYChart = New XYChart(500, 350)
' Add a title to the chart using 15pt Arial Italic font
c.addTitle("Energy Generation Breakdown", "Arial Italic", 15)
' Set the plotarea at (60, 60) and of (chart_width - 90) x (chart_height - 100) in size. Use a
' vertical gradient color from light blue (f9f9ff) to sky blue (aaccff) as background. Set grid
' lines to white (ffffff).
Dim plotAreaBgColor As Integer = c.linearGradientColor(0, 60, 0, c.getHeight() - 40, &Haaccff, _
&Hf9fcff)
c.setPlotArea(60, 60, c.getWidth() - 90, c.getHeight() - 100, plotAreaBgColor, -1, -1, _
&Hffffff)
' Add a legend box at (50, 30) using horizontal layout and transparent background.
c.addLegend(55, 30, False).setBackground(Chart.Transparent)
' Add titles to x/y axes with 10 points Arial Bold font
c.xAxis().setTitle("Mega Watts", "Arial Bold", 10)
c.yAxis().setTitle("Cost per MWh (dollars)", "Arial Bold", 10)
' Set the x axis rounding to false, so that the x-axis will fit the data exactly
c.xAxis().setRounding(False, False)
' In ChartDirector, there is no bar layer that can have variable bar widths, but you may create
' a bar using an area layer. (A bar can be considered as the area under a rectangular outline.)
' So by using a loop to create one bar per area layer, we can achieve a variable width bar
' chart.
' starting position of current bar
Dim currentX As Double = 0
For i As Integer = 0 To UBound(data)
' ending position of current bar
Dim nextX As Double = currentX + widths(i)
' outline of the bar
Dim dataX() As Double = {currentX, currentX, nextX, nextX}
Dim dataY() As Double = {0, data(i), data(i), 0}
' create the area layer to fill the bar
Dim layer As AreaLayer = c.addAreaLayer(dataY, colors(i), labels(i))
layer.setXData(dataX)
' Tool tip for the layer
layer.setHTMLImageMap("", "", "title='" & labels(i) & ": " & widths(i) & " MW at $" & _
data(i) & " per MWh'")
' the ending position becomes the starting position of the next bar
currentX = nextX
Next
' Output the chart
WebChartViewer1.Image = c.makeWebImage(Chart.SVG)
' Include tool tip for the chart
WebChartViewer1.ImageMap = c.getHTMLImageMap("")
End Sub
</script>
<html>
<head>
<script type="text/javascript" src="cdjcv.js"></script>
</head>
<body>
<chart:WebChartViewer id="WebChartViewer1" runat="server" />
</body>
</html>
[ASP.NET MVC - Controller] NetMvcCharts\Controllers\VarwidthbarController.cs
using System;
using System.Web.Mvc;
using ChartDirector;

namespace NetMvcCharts.Controllers
{
    public class VarwidthbarController : Controller
    {
        //
        // Default Action
        //
        public ActionResult Index()
        {
            ViewBag.Title = "Variable Width Bar Chart";
            createChart(ViewBag.Viewer = new RazorChartViewer(HttpContext, "chart1"));
            return View("~/Views/Shared/ChartView.cshtml");
        }

        //
        // Create chart
        //
        private void createChart(RazorChartViewer viewer)
        {
            // The data for the chart
            double[] data = {800, 600, 1000, 1400};
            double[] widths = {250, 500, 960, 460};
            string[] labels = {"Wind", "Hydro", "Coal", "Natural Gas"};

            // The colors to use
            int[] colors = {0x00aa00, 0x66aaee, 0xee6622, 0xffbb00};

            // Create a XYChart object of size 500 x 350 pixels
            XYChart c = new XYChart(500, 350);

            // Add a title to the chart using 15pt Arial Italic font
            c.addTitle("Energy Generation Breakdown", "Arial Italic", 15);

            // Set the plotarea at (60, 60) and of (chart_width - 90) x (chart_height - 100) in size. Use
            // a vertical gradient color from light blue (f9f9ff) to sky blue (aaccff) as background. Set
            // grid lines to white (ffffff).
            int plotAreaBgColor = c.linearGradientColor(0, 60, 0, c.getHeight() - 40, 0xaaccff, 0xf9fcff)
                ;
            c.setPlotArea(60, 60, c.getWidth() - 90, c.getHeight() - 100, plotAreaBgColor, -1, -1,
                0xffffff);

            // Add a legend box at (50, 30) using horizontal layout and transparent background.
            c.addLegend(55, 30, false).setBackground(Chart.Transparent);

            // Add titles to x/y axes with 10 points Arial Bold font
            c.xAxis().setTitle("Mega Watts", "Arial Bold", 10);
            c.yAxis().setTitle("Cost per MWh (dollars)", "Arial Bold", 10);

            // Set the x axis rounding to false, so that the x-axis will fit the data exactly
            c.xAxis().setRounding(false, false);

            // In ChartDirector, there is no bar layer that can have variable bar widths, but you may
            // create a bar using an area layer. (A bar can be considered as the area under a rectangular
            // outline.) So by using a loop to create one bar per area layer, we can achieve a variable
            // width bar chart.

            // starting position of current bar
            double currentX = 0;

            for(int i = 0; i < data.Length; ++i) {
                // ending position of current bar
                double nextX = currentX + widths[i];

                // outline of the bar
                double[] dataX = {currentX, currentX, nextX, nextX};
                double[] dataY = {0, data[i], data[i], 0};

                // create the area layer to fill the bar
                AreaLayer layer = c.addAreaLayer(dataY, colors[i], labels[i]);
                layer.setXData(dataX);

                // Tool tip for the layer
                layer.setHTMLImageMap("", "", "title='" + labels[i] + ": " + widths[i] + " MW at $" +
                    data[i] + " per MWh'");

                // the ending position becomes the starting position of the next bar
                currentX = nextX;
            }

            // Output the chart
            viewer.Image = c.makeWebImage(Chart.SVG);

            // Include tool tip for the chart
            viewer.ImageMap = c.getHTMLImageMap("");
        }
    }
}
[ASP.NET MVC - View] NetMvcCharts\Views\Shared\ChartView.cshtml
@{ Layout = null; }

<!DOCTYPE html>

<html>
<head>
    <meta name="viewport" content="width=device-width" />
    <title>@ViewBag.Title</title>
    <style>
        @ViewBag.Style
    </style>
    @Scripts.Render("~/Scripts/cdjcv.js")
</head>
<body style="margin:5px 0px 0px 5px">
    <div style="font:bold 18pt verdana;">
        @ViewBag.Title
    </div>
    <hr style="border:solid 1px #000080; background:#000080" />
    <div>
        @{
            if (ViewBag.Viewer is Array)
            {
                // Display multiple charts
                for (int i = 0; i < ViewBag.Viewer.Length; ++i)
                {
                    @:@Html.Raw(ViewBag.Viewer[i].RenderHTML())
                }
            }
            else
            {
                // Display one chart only
                @:@Html.Raw(ViewBag.Viewer.RenderHTML())
            }
        }
    </div>
</body>
</html>
© 2023 Advanced Software Engineering Limited. All rights reserved.