[Windows Forms - C# version] NetWinCharts\CSharpWinCharts\vbarmeterorientation.cs
using System;
using ChartDirector;
namespace CSharpChartExplorer
{
public class vbarmeterorientation : DemoModule
{
//Name of demo module
public string getName() { return "V-Bar Meter Orientation"; }
//Number of charts produced in this demo module
public int getNoOfCharts() { return 4; }
//Main code for creating charts
public void createChart(WinChartViewer viewer, int chartIndex)
{
// The value to display on the meter
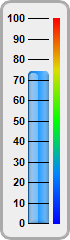
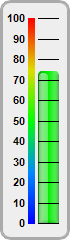
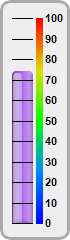
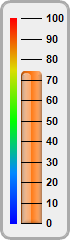
double value = 74.25;
// Bar colors of the meters
int[] barColor = {0x2299ff, 0x00ee00, 0xaa66ee, 0xff7711};
// Create a LinearMeter object of size 70 x 240 pixels with very light grey (0xeeeeee)
// backgruond and a grey (0xaaaaaa) 3-pixel thick rounded frame
LinearMeter m = new LinearMeter(70, 240, 0xeeeeee, 0xaaaaaa);
m.setRoundedFrame(Chart.Transparent);
m.setThickFrame(3);
// This example demonstrates putting the text labels at the left or right side of the
// meter scale, and putting the color scale on the same side as the labels or on
// opposite side.
int[] alignment = {Chart.Left, Chart.Left, Chart.Right, Chart.Right};
int[] meterXPos = {28, 38, 12, 21};
int[] labelGap = {2, 12, 10, 2};
int[] colorScalePos = {53, 28, 36, 10};
// Configure the position of the meter scale and which side to put the text labels
m.setMeter(meterXPos[chartIndex], 18, 20, 205, alignment[chartIndex]);
// Set meter scale from 0 - 100, with a tick every 10 units
m.setScale(0, 100, 10);
// To put the color scale on the same side as the text labels, we need to increase the
// gap between the labels and the meter scale to make room for the color scale
m.setLabelPos(false, labelGap[chartIndex]);
// Add a smooth color scale to the meter
double[] smoothColorScale = {0, 0x0000ff, 25, 0x0088ff, 50, 0x00ff00, 75, 0xdddd00, 100,
0xff0000};
m.addColorScale(smoothColorScale, colorScalePos[chartIndex], 6);
// Add a bar from 0 to value with glass effect and 4 pixel rounded corners
m.addBar(0, value, barColor[chartIndex], Chart.glassEffect(Chart.NormalGlare, Chart.Left
), 4);
// Output the chart
viewer.Chart = m;
}
}
}
[Windows Forms - VB Version] NetWinCharts\VBNetWinCharts\vbarmeterorientation.vb
Imports System
Imports Microsoft.VisualBasic
Imports ChartDirector

Public Class vbarmeterorientation
    Implements DemoModule

    'Name of demo module
    Public Function getName() As String Implements DemoModule.getName
        Return "V-Bar Meter Orientation"
    End Function

    'Number of charts produced in this demo module
    Public Function getNoOfCharts() As Integer Implements DemoModule.getNoOfCharts
        Return 4
    End Function

    'Main code for creating charts
    Public Sub createChart(viewer As WinChartViewer, chartIndex As Integer) _
        Implements DemoModule.createChart

        ' The value to display on the meter
        Dim value As Double = 74.25

        ' Bar colors of the meters
        Dim barColor() As Integer = {&H2299ff, &H00ee00, &Haa66ee, &Hff7711}

        ' Create a LinearMeter object of size 70 x 240 pixels with very light grey (0xeeeeee)
        ' backgruond and a grey (0xaaaaaa) 3-pixel thick rounded frame
        Dim m As LinearMeter = New LinearMeter(70, 240, &Heeeeee, &Haaaaaa)
        m.setRoundedFrame(Chart.Transparent)
        m.setThickFrame(3)

        ' This example demonstrates putting the text labels at the left or right side of the meter
        ' scale, and putting the color scale on the same side as the labels or on opposite side.
        Dim alignment() As Integer = {Chart.Left, Chart.Left, Chart.Right, Chart.Right}
        Dim meterXPos() As Integer = {28, 38, 12, 21}
        Dim labelGap() As Integer = {2, 12, 10, 2}
        Dim colorScalePos() As Integer = {53, 28, 36, 10}

        ' Configure the position of the meter scale and which side to put the text labels
        m.setMeter(meterXPos(chartIndex), 18, 20, 205, alignment(chartIndex))

        ' Set meter scale from 0 - 100, with a tick every 10 units
        m.setScale(0, 100, 10)

        ' To put the color scale on the same side as the text labels, we need to increase the gap
        ' between the labels and the meter scale to make room for the color scale
        m.setLabelPos(False, labelGap(chartIndex))

        ' Add a smooth color scale to the meter
        Dim smoothColorScale() As Double = {0, &H0000ff, 25, &H0088ff, 50, &H00ff00, 75, &Hdddd00, _
            100, &Hff0000}
        m.addColorScale(smoothColorScale, colorScalePos(chartIndex), 6)

        ' Add a bar from 0 to value with glass effect and 4 pixel rounded corners
        m.addBar(0, value, barColor(chartIndex), Chart.glassEffect(Chart.NormalGlare, Chart.Left),4)

        ' Output the chart
        viewer.Chart = m

    End Sub

End Class
[WPF - C#] NetWPFCharts\CSharpWPFCharts\vbarmeterorientation.cs
using System;
using ChartDirector;

namespace CSharpWPFCharts
{
    public class vbarmeterorientation : DemoModule
    {
        //Name of demo module
        public string getName() { return "V-Bar Meter Orientation"; }

        //Number of charts produced in this demo module
        public int getNoOfCharts() { return 4; }

        //Main code for creating charts
        public void createChart(WPFChartViewer viewer, int chartIndex)
        {
            // The value to display on the meter
            double value = 74.25;

            // Bar colors of the meters
            int[] barColor = {0x2299ff, 0x00ee00, 0xaa66ee, 0xff7711};

            // Create a LinearMeter object of size 70 x 240 pixels with very light grey (0xeeeeee)
            // backgruond and a grey (0xaaaaaa) 3-pixel thick rounded frame
            LinearMeter m = new LinearMeter(70, 240, 0xeeeeee, 0xaaaaaa);
            m.setRoundedFrame(Chart.Transparent);
            m.setThickFrame(3);

            // This example demonstrates putting the text labels at the left or right side of the
            // meter scale, and putting the color scale on the same side as the labels or on
            // opposite side.
            int[] alignment = {Chart.Left, Chart.Left, Chart.Right, Chart.Right};
            int[] meterXPos = {28, 38, 12, 21};
            int[] labelGap = {2, 12, 10, 2};
            int[] colorScalePos = {53, 28, 36, 10};

            // Configure the position of the meter scale and which side to put the text labels
            m.setMeter(meterXPos[chartIndex], 18, 20, 205, alignment[chartIndex]);

            // Set meter scale from 0 - 100, with a tick every 10 units
            m.setScale(0, 100, 10);

            // To put the color scale on the same side as the text labels, we need to increase the
            // gap between the labels and the meter scale to make room for the color scale
            m.setLabelPos(false, labelGap[chartIndex]);

            // Add a smooth color scale to the meter
            double[] smoothColorScale = {0, 0x0000ff, 25, 0x0088ff, 50, 0x00ff00, 75, 0xdddd00, 100,
                0xff0000};
            m.addColorScale(smoothColorScale, colorScalePos[chartIndex], 6);

            // Add a bar from 0 to value with glass effect and 4 pixel rounded corners
            m.addBar(0, value, barColor[chartIndex], Chart.glassEffect(Chart.NormalGlare, Chart.Left
                ), 4);

            // Output the chart
            viewer.Chart = m;
        }
    }
}
[ASP.NET Web Forms - C# version] NetWebCharts\CSharpASP\vbarmeterorientation.aspx
(Click here on how to convert this code to code-behind style.)<%@ Page Language="C#" Debug="true" %>
<%@ Import Namespace="ChartDirector" %>
<%@ Register TagPrefix="chart" Namespace="ChartDirector" Assembly="netchartdir" %>
<!DOCTYPE html>
<script runat="server">
//
// Create chart
//
protected void createChart(WebChartViewer viewer, int chartIndex)
{
// The value to display on the meter
double value = 74.25;
// Bar colors of the meters
int[] barColor = {0x2299ff, 0x00ee00, 0xaa66ee, 0xff7711};
// Create a LinearMeter object of size 70 x 240 pixels with very light grey (0xeeeeee)
// backgruond and a grey (0xaaaaaa) 3-pixel thick rounded frame
LinearMeter m = new LinearMeter(70, 240, 0xeeeeee, 0xaaaaaa);
m.setRoundedFrame(Chart.Transparent);
m.setThickFrame(3);
// This example demonstrates putting the text labels at the left or right side of the meter
// scale, and putting the color scale on the same side as the labels or on opposite side.
int[] alignment = {Chart.Left, Chart.Left, Chart.Right, Chart.Right};
int[] meterXPos = {28, 38, 12, 21};
int[] labelGap = {2, 12, 10, 2};
int[] colorScalePos = {53, 28, 36, 10};
// Configure the position of the meter scale and which side to put the text labels
m.setMeter(meterXPos[chartIndex], 18, 20, 205, alignment[chartIndex]);
// Set meter scale from 0 - 100, with a tick every 10 units
m.setScale(0, 100, 10);
// To put the color scale on the same side as the text labels, we need to increase the gap
// between the labels and the meter scale to make room for the color scale
m.setLabelPos(false, labelGap[chartIndex]);
// Add a smooth color scale to the meter
double[] smoothColorScale = {0, 0x0000ff, 25, 0x0088ff, 50, 0x00ff00, 75, 0xdddd00, 100,
0xff0000};
m.addColorScale(smoothColorScale, colorScalePos[chartIndex], 6);
// Add a bar from 0 to value with glass effect and 4 pixel rounded corners
m.addBar(0, value, barColor[chartIndex], Chart.glassEffect(Chart.NormalGlare, Chart.Left), 4);
// Output the chart
viewer.Image = m.makeWebImage(Chart.SVG);
}
//
// Page Load event handler
//
protected void Page_Load(object sender, EventArgs e)
{
createChart(WebChartViewer0, 0);
createChart(WebChartViewer1, 1);
createChart(WebChartViewer2, 2);
createChart(WebChartViewer3, 3);
}
</script>
<html>
<head>
<script type="text/javascript" src="cdjcv.js"></script>
</head>
<body>
<chart:WebChartViewer id="WebChartViewer0" runat="server" style='margin-right:25px;' />
<chart:WebChartViewer id="WebChartViewer1" runat="server" style='margin-right:25px;' />
<chart:WebChartViewer id="WebChartViewer2" runat="server" style='margin-right:25px;' />
<chart:WebChartViewer id="WebChartViewer3" runat="server" />
</body>
</html>
[ASP.NET Web Forms - VB Version] NetWebCharts\VBNetASP\vbarmeterorientation.aspx
(Click here on how to convert this code to code-behind style.)<%@ Page Language="VB" Debug="true" %>
<%@ Import Namespace="ChartDirector" %>
<%@ Register TagPrefix="chart" Namespace="ChartDirector" Assembly="netchartdir" %>
<!DOCTYPE html>
<script runat="server">
'
' Create chart
'
Protected Sub createChart(viewer As WebChartViewer, chartIndex As Integer)
' The value to display on the meter
Dim value As Double = 74.25
' Bar colors of the meters
Dim barColor() As Integer = {&H2299ff, &H00ee00, &Haa66ee, &Hff7711}
' Create a LinearMeter object of size 70 x 240 pixels with very light grey (0xeeeeee) backgruond
' and a grey (0xaaaaaa) 3-pixel thick rounded frame
Dim m As LinearMeter = New LinearMeter(70, 240, &Heeeeee, &Haaaaaa)
m.setRoundedFrame(Chart.Transparent)
m.setThickFrame(3)
' This example demonstrates putting the text labels at the left or right side of the meter
' scale, and putting the color scale on the same side as the labels or on opposite side.
Dim alignment() As Integer = {Chart.Left, Chart.Left, Chart.Right, Chart.Right}
Dim meterXPos() As Integer = {28, 38, 12, 21}
Dim labelGap() As Integer = {2, 12, 10, 2}
Dim colorScalePos() As Integer = {53, 28, 36, 10}
' Configure the position of the meter scale and which side to put the text labels
m.setMeter(meterXPos(chartIndex), 18, 20, 205, alignment(chartIndex))
' Set meter scale from 0 - 100, with a tick every 10 units
m.setScale(0, 100, 10)
' To put the color scale on the same side as the text labels, we need to increase the gap
' between the labels and the meter scale to make room for the color scale
m.setLabelPos(False, labelGap(chartIndex))
' Add a smooth color scale to the meter
Dim smoothColorScale() As Double = {0, &H0000ff, 25, &H0088ff, 50, &H00ff00, 75, &Hdddd00, _
100, &Hff0000}
m.addColorScale(smoothColorScale, colorScalePos(chartIndex), 6)
' Add a bar from 0 to value with glass effect and 4 pixel rounded corners
m.addBar(0, value, barColor(chartIndex), Chart.glassEffect(Chart.NormalGlare, Chart.Left), 4)
' Output the chart
viewer.Image = m.makeWebImage(Chart.SVG)
End Sub
'
' Page Load event handler
'
Protected Sub Page_Load(ByVal sender As System.Object, ByVal e As System.EventArgs)
createChart(WebChartViewer0, 0)
createChart(WebChartViewer1, 1)
createChart(WebChartViewer2, 2)
createChart(WebChartViewer3, 3)
End Sub
</script>
<html>
<head>
<script type="text/javascript" src="cdjcv.js"></script>
</head>
<body>
<chart:WebChartViewer id="WebChartViewer0" runat="server" style='margin-right:25px;' />
<chart:WebChartViewer id="WebChartViewer1" runat="server" style='margin-right:25px;' />
<chart:WebChartViewer id="WebChartViewer2" runat="server" style='margin-right:25px;' />
<chart:WebChartViewer id="WebChartViewer3" runat="server" />
</body>
</html>
[ASP.NET MVC - Controller] NetMvcCharts\Controllers\VbarmeterorientationController.cs
using System;
using System.Web.Mvc;
using ChartDirector;

namespace NetMvcCharts.Controllers
{
    public class VbarmeterorientationController : Controller
    {
        //
        // Default Action
        //
        public ActionResult Index()
        {
            ViewBag.Title = "V-Bar Meter Orientation";

            // This example contains 4 charts.
            ViewBag.Viewer = new RazorChartViewer[4];
            for (int i = 0; i < ViewBag.Viewer.Length; ++i)
                createChart(ViewBag.Viewer[i] = new RazorChartViewer(HttpContext, "chart" + i), i);

            return View("~/Views/Shared/ChartView.cshtml");
        }

        //
        // Create chart
        //
        private void createChart(RazorChartViewer viewer, int chartIndex)
        {
            // The value to display on the meter
            double value = 74.25;

            // Bar colors of the meters
            int[] barColor = {0x2299ff, 0x00ee00, 0xaa66ee, 0xff7711};

            // Create a LinearMeter object of size 70 x 240 pixels with very light grey (0xeeeeee)
            // backgruond and a grey (0xaaaaaa) 3-pixel thick rounded frame
            LinearMeter m = new LinearMeter(70, 240, 0xeeeeee, 0xaaaaaa);
            m.setRoundedFrame(Chart.Transparent);
            m.setThickFrame(3);

            // This example demonstrates putting the text labels at the left or right side of the meter
            // scale, and putting the color scale on the same side as the labels or on opposite side.
            int[] alignment = {Chart.Left, Chart.Left, Chart.Right, Chart.Right};
            int[] meterXPos = {28, 38, 12, 21};
            int[] labelGap = {2, 12, 10, 2};
            int[] colorScalePos = {53, 28, 36, 10};

            // Configure the position of the meter scale and which side to put the text labels
            m.setMeter(meterXPos[chartIndex], 18, 20, 205, alignment[chartIndex]);

            // Set meter scale from 0 - 100, with a tick every 10 units
            m.setScale(0, 100, 10);

            // To put the color scale on the same side as the text labels, we need to increase the gap
            // between the labels and the meter scale to make room for the color scale
            m.setLabelPos(false, labelGap[chartIndex]);

            // Add a smooth color scale to the meter
            double[] smoothColorScale = {0, 0x0000ff, 25, 0x0088ff, 50, 0x00ff00, 75, 0xdddd00, 100,
                0xff0000};
            m.addColorScale(smoothColorScale, colorScalePos[chartIndex], 6);

            // Add a bar from 0 to value with glass effect and 4 pixel rounded corners
            m.addBar(0, value, barColor[chartIndex], Chart.glassEffect(Chart.NormalGlare, Chart.Left), 4)
                ;

            // Output the chart
            viewer.Image = m.makeWebImage(Chart.SVG);
        }
    }
}
[ASP.NET MVC - View] NetMvcCharts\Views\Shared\ChartView.cshtml
@{ Layout = null; }

<!DOCTYPE html>

<html>
<head>
    <meta name="viewport" content="width=device-width" />
    <title>@ViewBag.Title</title>
    <style>
        @ViewBag.Style
    </style>
    @Scripts.Render("~/Scripts/cdjcv.js")
</head>
<body style="margin:5px 0px 0px 5px">
    <div style="font:bold 18pt verdana;">
        @ViewBag.Title
    </div>
    <hr style="border:solid 1px #000080; background:#000080" />
    <div>
        @{
            if (ViewBag.Viewer is Array)
            {
                // Display multiple charts
                for (int i = 0; i < ViewBag.Viewer.Length; ++i)
                {
                    @:@Html.Raw(ViewBag.Viewer[i].RenderHTML())
                }
            }
            else
            {
                // Display one chart only
                @:@Html.Raw(ViewBag.Viewer.RenderHTML())
            }
        }
    </div>
</body>
</html>
© 2023 Advanced Software Engineering Limited. All rights reserved.