[Windows Forms - C# version] NetWinCharts\CSharpWinCharts\waterfall.cs
using System;
using ChartDirector;
namespace CSharpChartExplorer
{
public class waterfall : DemoModule
{
//Name of demo module
public string getName() { return "Waterfall Chart"; }
//Number of charts produced in this demo module
public int getNoOfCharts() { return 1; }
//Main code for creating chart.
//Note: the argument chartIndex is unused because this demo only has 1 chart.
public void createChart(WinChartViewer viewer, int chartIndex)
{
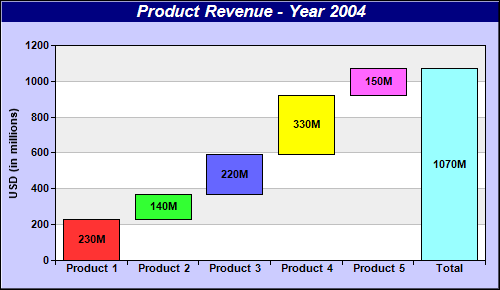
// 4 data points to represent the cash flow for the Q1 - Q4
double[] data = {230, 140, 220, 330, 150};
// We want to plot a waterfall chart showing the 4 quarters as well as the total
string[] labels = {"Product 1", "Product 2", "Product 3", "Product 4", "Product 5",
"Total"};
// The top side of the bars in a waterfall chart is the accumulated data. We use the
// ChartDirector ArrayMath utility to accumulate the data. The "total" is handled by
// inserting a zero point at the end before accumulation (after accumulation it will
// become the total).
double[] boxTop = new ArrayMath(data).insert2(0, 1).acc().result();
// The botom side of the bars is just the top side of the previous bar. So we shifted
// the top side data to obtain the bottom side data.
double[] boxBottom = new ArrayMath(boxTop).shift(1, 0).result();
// The last point (total) is different. Its bottom side is always 0.
boxBottom[boxBottom.Length - 1] = 0;
// Create a XYChart object of size 500 x 280 pixels. Set background color to light blue
// (ccccff), with 1 pixel 3D border effect.
XYChart c = new XYChart(500, 290, 0xccccff, 0x000000, 1);
// Add a title to the chart using 13 points Arial Bold Itatic font, with white (ffffff)
// text on a deep blue (0x80) background
c.addTitle("Product Revenue - Year 2004", "Arial Bold Italic", 13, 0xffffff
).setBackground(0x000080);
// Set the plotarea at (55, 50) and of size 430 x 215 pixels. Use alternative white/grey
// background.
c.setPlotArea(55, 45, 430, 215, 0xffffff, 0xeeeeee);
// Set the labels on the x axis using Arial Bold font
c.xAxis().setLabels(labels).setFontStyle("Arial Bold");
// Set the x-axis ticks and grid lines to be between the bars
c.xAxis().setTickOffset(0.5);
// Use Arial Bold as the y axis label font
c.yAxis().setLabelStyle("Arial Bold");
// Add a title to the y axis
c.yAxis().setTitle("USD (in millions)");
// Add a multi-color box-whisker layer to represent the waterfall bars
BoxWhiskerLayer layer = c.addBoxWhiskerLayer2(boxTop, boxBottom);
// Put data labels on the bars to show the cash flow using Arial Bold font
layer.setDataLabelFormat("{={top}-{bottom}}M");
layer.setDataLabelStyle("Arial Bold").setAlignment(Chart.Center);
// Output the chart
viewer.Chart = c;
//include tool tip for the chart
viewer.ImageMap = c.getHTMLImageMap("clickable", "",
"title='{xLabel}: {={top}-{bottom}} millions'");
}
}
}
[Windows Forms - VB Version] NetWinCharts\VBNetWinCharts\waterfall.vb
Imports System
Imports Microsoft.VisualBasic
Imports ChartDirector

Public Class waterfall
    Implements DemoModule

    'Name of demo module
    Public Function getName() As String Implements DemoModule.getName
        Return "Waterfall Chart"
    End Function

    'Number of charts produced in this demo module
    Public Function getNoOfCharts() As Integer Implements DemoModule.getNoOfCharts
        Return 1
    End Function

    'Main code for creating chart.
    'Note: the argument chartIndex is unused because this demo only has 1 chart.
    Public Sub createChart(viewer As WinChartViewer, chartIndex As Integer) _
        Implements DemoModule.createChart

        ' 4 data points to represent the cash flow for the Q1 - Q4
        Dim data() As Double = {230, 140, 220, 330, 150}

        ' We want to plot a waterfall chart showing the 4 quarters as well as the total
        Dim labels() As String = {"Product 1", "Product 2", "Product 3", "Product 4", "Product 5", _
            "Total"}

        ' The top side of the bars in a waterfall chart is the accumulated data. We use the
        ' ChartDirector ArrayMath utility to accumulate the data. The "total" is handled by
        ' inserting a zero point at the end before accumulation (after accumulation it will become
        ' the total).
        Dim boxTop() As Double = New ArrayMath(data).insert2(0, 1).acc().result()

        ' The botom side of the bars is just the top side of the previous bar. So we shifted the top
        ' side data to obtain the bottom side data.
        Dim boxBottom() As Double = New ArrayMath(boxTop).shift(1, 0).result()

        ' The last point (total) is different. Its bottom side is always 0.
        boxBottom(UBound(boxBottom)) = 0

        ' Create a XYChart object of size 500 x 280 pixels. Set background color to light blue
        ' (ccccff), with 1 pixel 3D border effect.
        Dim c As XYChart = New XYChart(500, 290, &Hccccff, &H000000, 1)

        ' Add a title to the chart using 13 points Arial Bold Itatic font, with white (ffffff) text
        ' on a deep blue (0x80) background
        c.addTitle("Product Revenue - Year 2004", "Arial Bold Italic", 13, &Hffffff _
            ).setBackground(&H000080)

        ' Set the plotarea at (55, 50) and of size 430 x 215 pixels. Use alternative white/grey
        ' background.
        c.setPlotArea(55, 45, 430, 215, &Hffffff, &Heeeeee)

        ' Set the labels on the x axis using Arial Bold font
        c.xAxis().setLabels(labels).setFontStyle("Arial Bold")

        ' Set the x-axis ticks and grid lines to be between the bars
        c.xAxis().setTickOffset(0.5)

        ' Use Arial Bold as the y axis label font
        c.yAxis().setLabelStyle("Arial Bold")

        ' Add a title to the y axis
        c.yAxis().setTitle("USD (in millions)")

        ' Add a multi-color box-whisker layer to represent the waterfall bars
        Dim layer As BoxWhiskerLayer = c.addBoxWhiskerLayer2(boxTop, boxBottom)

        ' Put data labels on the bars to show the cash flow using Arial Bold font
        layer.setDataLabelFormat("{={top}-{bottom}}M")
        layer.setDataLabelStyle("Arial Bold").setAlignment(Chart.Center)

        ' Output the chart
        viewer.Chart = c

        'include tool tip for the chart
        viewer.ImageMap = c.getHTMLImageMap("clickable", "", _
            "title='{xLabel}: {={top}-{bottom}} millions'")

    End Sub

End Class
[WPF - C#] NetWPFCharts\CSharpWPFCharts\waterfall.cs
using System;
using ChartDirector;

namespace CSharpWPFCharts
{
    public class waterfall : DemoModule
    {
        //Name of demo module
        public string getName() { return "Waterfall Chart"; }

        //Number of charts produced in this demo module
        public int getNoOfCharts() { return 1; }

        //Main code for creating chart.
        //Note: the argument chartIndex is unused because this demo only has 1 chart.
        public void createChart(WPFChartViewer viewer, int chartIndex)
        {
            // 4 data points to represent the cash flow for the Q1 - Q4
            double[] data = {230, 140, 220, 330, 150};

            // We want to plot a waterfall chart showing the 4 quarters as well as the total
            string[] labels = {"Product 1", "Product 2", "Product 3", "Product 4", "Product 5",
                "Total"};

            // The top side of the bars in a waterfall chart is the accumulated data. We use the
            // ChartDirector ArrayMath utility to accumulate the data. The "total" is handled by
            // inserting a zero point at the end before accumulation (after accumulation it will
            // become the total).
            double[] boxTop = new ArrayMath(data).insert2(0, 1).acc().result();

            // The botom side of the bars is just the top side of the previous bar. So we shifted
            // the top side data to obtain the bottom side data.
            double[] boxBottom = new ArrayMath(boxTop).shift(1, 0).result();

            // The last point (total) is different. Its bottom side is always 0.
            boxBottom[boxBottom.Length - 1] = 0;

            // Create a XYChart object of size 500 x 280 pixels. Set background color to light blue
            // (ccccff), with 1 pixel 3D border effect.
            XYChart c = new XYChart(500, 290, 0xccccff, 0x000000, 1);

            // Add a title to the chart using 13 points Arial Bold Itatic font, with white (ffffff)
            // text on a deep blue (0x80) background
            c.addTitle("Product Revenue - Year 2004", "Arial Bold Italic", 13, 0xffffff
                ).setBackground(0x000080);

            // Set the plotarea at (55, 50) and of size 430 x 215 pixels. Use alternative white/grey
            // background.
            c.setPlotArea(55, 45, 430, 215, 0xffffff, 0xeeeeee);

            // Set the labels on the x axis using Arial Bold font
            c.xAxis().setLabels(labels).setFontStyle("Arial Bold");

            // Set the x-axis ticks and grid lines to be between the bars
            c.xAxis().setTickOffset(0.5);

            // Use Arial Bold as the y axis label font
            c.yAxis().setLabelStyle("Arial Bold");

            // Add a title to the y axis
            c.yAxis().setTitle("USD (in millions)");

            // Add a multi-color box-whisker layer to represent the waterfall bars
            BoxWhiskerLayer layer = c.addBoxWhiskerLayer2(boxTop, boxBottom);

            // Put data labels on the bars to show the cash flow using Arial Bold font
            layer.setDataLabelFormat("{={top}-{bottom}}M");
            layer.setDataLabelStyle("Arial Bold").setAlignment(Chart.Center);

            // Output the chart
            viewer.Chart = c;

            //include tool tip for the chart
            viewer.ImageMap = c.getHTMLImageMap("clickable", "",
                "title='{xLabel}: {={top}-{bottom}} millions'");
        }
    }
}
[ASP.NET Web Forms - C# version] NetWebCharts\CSharpASP\waterfall.aspx
(Click here on how to convert this code to code-behind style.)<%@ Page Language="C#" Debug="true" %>
<%@ Import Namespace="ChartDirector" %>
<%@ Register TagPrefix="chart" Namespace="ChartDirector" Assembly="netchartdir" %>
<!DOCTYPE html>
<script runat="server">
//
// Page Load event handler
//
protected void Page_Load(object sender, EventArgs e)
{
// 4 data points to represent the cash flow for the Q1 - Q4
double[] data = {230, 140, 220, 330, 150};
// We want to plot a waterfall chart showing the 4 quarters as well as the total
string[] labels = {"Product 1", "Product 2", "Product 3", "Product 4", "Product 5", "Total"};
// The top side of the bars in a waterfall chart is the accumulated data. We use the
// ChartDirector ArrayMath utility to accumulate the data. The "total" is handled by inserting a
// zero point at the end before accumulation (after accumulation it will become the total).
double[] boxTop = new ArrayMath(data).insert2(0, 1).acc().result();
// The botom side of the bars is just the top side of the previous bar. So we shifted the top
// side data to obtain the bottom side data.
double[] boxBottom = new ArrayMath(boxTop).shift(1, 0).result();
// The last point (total) is different. Its bottom side is always 0.
boxBottom[boxBottom.Length - 1] = 0;
// Create a XYChart object of size 500 x 280 pixels. Set background color to light blue
// (ccccff), with 1 pixel 3D border effect.
XYChart c = new XYChart(500, 290, 0xccccff, 0x000000, 1);
// Add a title to the chart using 13 points Arial Bold Itatic font, with white (ffffff) text on
// a deep blue (0x80) background
c.addTitle("Product Revenue - Year 2004", "Arial Bold Italic", 13, 0xffffff).setBackground(
0x000080);
// Set the plotarea at (55, 50) and of size 430 x 215 pixels. Use alternative white/grey
// background.
c.setPlotArea(55, 45, 430, 215, 0xffffff, 0xeeeeee);
// Set the labels on the x axis using Arial Bold font
c.xAxis().setLabels(labels).setFontStyle("Arial Bold");
// Set the x-axis ticks and grid lines to be between the bars
c.xAxis().setTickOffset(0.5);
// Use Arial Bold as the y axis label font
c.yAxis().setLabelStyle("Arial Bold");
// Add a title to the y axis
c.yAxis().setTitle("USD (in millions)");
// Add a multi-color box-whisker layer to represent the waterfall bars
BoxWhiskerLayer layer = c.addBoxWhiskerLayer2(boxTop, boxBottom);
// Put data labels on the bars to show the cash flow using Arial Bold font
layer.setDataLabelFormat("{={top}-{bottom}}M");
layer.setDataLabelStyle("Arial Bold").setAlignment(Chart.Center);
// Output the chart
WebChartViewer1.Image = c.makeWebImage(Chart.SVG);
// Include tool tip for the chart
WebChartViewer1.ImageMap = c.getHTMLImageMap("", "",
"title='{xLabel}: {={top}-{bottom}} millions'");
}
</script>
<html>
<head>
<script type="text/javascript" src="cdjcv.js"></script>
</head>
<body>
<chart:WebChartViewer id="WebChartViewer1" runat="server" />
</body>
</html>
[ASP.NET Web Forms - VB Version] NetWebCharts\VBNetASP\waterfall.aspx
(Click here on how to convert this code to code-behind style.)<%@ Page Language="VB" Debug="true" %>
<%@ Import Namespace="ChartDirector" %>
<%@ Register TagPrefix="chart" Namespace="ChartDirector" Assembly="netchartdir" %>
<!DOCTYPE html>
<script runat="server">
'
' Page Load event handler
'
Protected Sub Page_Load(ByVal sender As System.Object, ByVal e As System.EventArgs)
' 4 data points to represent the cash flow for the Q1 - Q4
Dim data() As Double = {230, 140, 220, 330, 150}
' We want to plot a waterfall chart showing the 4 quarters as well as the total
Dim labels() As String = {"Product 1", "Product 2", "Product 3", "Product 4", "Product 5", _
"Total"}
' The top side of the bars in a waterfall chart is the accumulated data. We use the
' ChartDirector ArrayMath utility to accumulate the data. The "total" is handled by inserting a
' zero point at the end before accumulation (after accumulation it will become the total).
Dim boxTop() As Double = New ArrayMath(data).insert2(0, 1).acc().result()
' The botom side of the bars is just the top side of the previous bar. So we shifted the top
' side data to obtain the bottom side data.
Dim boxBottom() As Double = New ArrayMath(boxTop).shift(1, 0).result()
' The last point (total) is different. Its bottom side is always 0.
boxBottom(UBound(boxBottom)) = 0
' Create a XYChart object of size 500 x 280 pixels. Set background color to light blue (ccccff),
' with 1 pixel 3D border effect.
Dim c As XYChart = New XYChart(500, 290, &Hccccff, &H000000, 1)
' Add a title to the chart using 13 points Arial Bold Itatic font, with white (ffffff) text on a
' deep blue (0x80) background
c.addTitle("Product Revenue - Year 2004", "Arial Bold Italic", 13, &Hffffff).setBackground( _
&H000080)
' Set the plotarea at (55, 50) and of size 430 x 215 pixels. Use alternative white/grey
' background.
c.setPlotArea(55, 45, 430, 215, &Hffffff, &Heeeeee)
' Set the labels on the x axis using Arial Bold font
c.xAxis().setLabels(labels).setFontStyle("Arial Bold")
' Set the x-axis ticks and grid lines to be between the bars
c.xAxis().setTickOffset(0.5)
' Use Arial Bold as the y axis label font
c.yAxis().setLabelStyle("Arial Bold")
' Add a title to the y axis
c.yAxis().setTitle("USD (in millions)")
' Add a multi-color box-whisker layer to represent the waterfall bars
Dim layer As BoxWhiskerLayer = c.addBoxWhiskerLayer2(boxTop, boxBottom)
' Put data labels on the bars to show the cash flow using Arial Bold font
layer.setDataLabelFormat("{={top}-{bottom}}M")
layer.setDataLabelStyle("Arial Bold").setAlignment(Chart.Center)
' Output the chart
WebChartViewer1.Image = c.makeWebImage(Chart.SVG)
' Include tool tip for the chart
WebChartViewer1.ImageMap = c.getHTMLImageMap("", "", _
"title='{xLabel}: {={top}-{bottom}} millions'")
End Sub
</script>
<html>
<head>
<script type="text/javascript" src="cdjcv.js"></script>
</head>
<body>
<chart:WebChartViewer id="WebChartViewer1" runat="server" />
</body>
</html>
[ASP.NET MVC - Controller] NetMvcCharts\Controllers\WaterfallController.cs
using System;
using System.Web.Mvc;
using ChartDirector;

namespace NetMvcCharts.Controllers
{
    public class WaterfallController : Controller
    {
        //
        // Default Action
        //
        public ActionResult Index()
        {
            ViewBag.Title = "Waterfall Chart";
            createChart(ViewBag.Viewer = new RazorChartViewer(HttpContext, "chart1"));
            return View("~/Views/Shared/ChartView.cshtml");
        }

        //
        // Create chart
        //
        private void createChart(RazorChartViewer viewer)
        {
            // 4 data points to represent the cash flow for the Q1 - Q4
            double[] data = {230, 140, 220, 330, 150};

            // We want to plot a waterfall chart showing the 4 quarters as well as the total
            string[] labels = {"Product 1", "Product 2", "Product 3", "Product 4", "Product 5", "Total"};

            // The top side of the bars in a waterfall chart is the accumulated data. We use the
            // ChartDirector ArrayMath utility to accumulate the data. The "total" is handled by
            // inserting a zero point at the end before accumulation (after accumulation it will become
            // the total).
            double[] boxTop = new ArrayMath(data).insert2(0, 1).acc().result();

            // The botom side of the bars is just the top side of the previous bar. So we shifted the top
            // side data to obtain the bottom side data.
            double[] boxBottom = new ArrayMath(boxTop).shift(1, 0).result();

            // The last point (total) is different. Its bottom side is always 0.
            boxBottom[boxBottom.Length - 1] = 0;

            // Create a XYChart object of size 500 x 280 pixels. Set background color to light blue
            // (ccccff), with 1 pixel 3D border effect.
            XYChart c = new XYChart(500, 290, 0xccccff, 0x000000, 1);

            // Add a title to the chart using 13 points Arial Bold Itatic font, with white (ffffff) text
            // on a deep blue (0x80) background
            c.addTitle("Product Revenue - Year 2004", "Arial Bold Italic", 13, 0xffffff).setBackground(
                0x000080);

            // Set the plotarea at (55, 50) and of size 430 x 215 pixels. Use alternative white/grey
            // background.
            c.setPlotArea(55, 45, 430, 215, 0xffffff, 0xeeeeee);

            // Set the labels on the x axis using Arial Bold font
            c.xAxis().setLabels(labels).setFontStyle("Arial Bold");

            // Set the x-axis ticks and grid lines to be between the bars
            c.xAxis().setTickOffset(0.5);

            // Use Arial Bold as the y axis label font
            c.yAxis().setLabelStyle("Arial Bold");

            // Add a title to the y axis
            c.yAxis().setTitle("USD (in millions)");

            // Add a multi-color box-whisker layer to represent the waterfall bars
            BoxWhiskerLayer layer = c.addBoxWhiskerLayer2(boxTop, boxBottom);

            // Put data labels on the bars to show the cash flow using Arial Bold font
            layer.setDataLabelFormat("{={top}-{bottom}}M");
            layer.setDataLabelStyle("Arial Bold").setAlignment(Chart.Center);

            // Output the chart
            viewer.Image = c.makeWebImage(Chart.SVG);

            // Include tool tip for the chart
            viewer.ImageMap = c.getHTMLImageMap("", "",
                "title='{xLabel}: {={top}-{bottom}} millions'");
        }
    }
}
[ASP.NET MVC - View] NetMvcCharts\Views\Shared\ChartView.cshtml
@{ Layout = null; }

<!DOCTYPE html>

<html>
<head>
    <meta name="viewport" content="width=device-width" />
    <title>@ViewBag.Title</title>
    <style>
        @ViewBag.Style
    </style>
    @Scripts.Render("~/Scripts/cdjcv.js")
</head>
<body style="margin:5px 0px 0px 5px">
    <div style="font:bold 18pt verdana;">
        @ViewBag.Title
    </div>
    <hr style="border:solid 1px #000080; background:#000080" />
    <div>
        @{
            if (ViewBag.Viewer is Array)
            {
                // Display multiple charts
                for (int i = 0; i < ViewBag.Viewer.Length; ++i)
                {
                    @:@Html.Raw(ViewBag.Viewer[i].RenderHTML())
                }
            }
            else
            {
                // Display one chart only
                @:@Html.Raw(ViewBag.Viewer.RenderHTML())
            }
        }
    </div>
</body>
</html>
© 2023 Advanced Software Engineering Limited. All rights reserved.