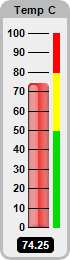
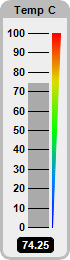
This example demonstrates vertical bar meters in a white coloring scheme, and with bars in various shading styles.
ChartDirector 7.1 (.NET Edition)
White Vertical Bar Meters
Source Code Listing
using System;
using ChartDirector;
namespace CSharpChartExplorer
{
public class whitevbarmeter : DemoModule
{
//Name of demo module
public string getName() { return "White Vertical Bar Meters"; }
//Number of charts produced in this demo module
public int getNoOfCharts() { return 6; }
//Main code for creating charts
public void createChart(WinChartViewer viewer, int chartIndex)
{
// The value to display on the meter
double value = 74.25;
// Create a LinearMeter object of size 70 x 260 pixels with very light grey (0xeeeeee)
// backgruond and a grey (0xbbbbbb) 3-pixel thick rounded frame
LinearMeter m = new LinearMeter(70, 260, 0xeeeeee, 0xbbbbbb);
m.setRoundedFrame(Chart.Transparent);
m.setThickFrame(3);
// Set the scale region top-left corner at (28, 33), with size of 20 x 194 pixels. The
// scale labels are located on the left (default - implies vertical meter).
m.setMeter(28, 33, 20, 194);
// Set meter scale from 0 - 100, with a tick every 10 units
m.setScale(0, 100, 10);
// Demostrate different types of color scales
double[] smoothColorScale = {0, 0x0000ff, 25, 0x0088ff, 50, 0x00ff00, 75, 0xdddd00, 100,
0xff0000};
double[] stepColorScale = {0, 0x00dd00, 50, 0xffff00, 80, 0xff0000, 100};
double[] highColorScale = {70, Chart.Transparent, 100, 0xff0000};
double[] lowColorScale = {0, 0x0000ff, 30, Chart.Transparent};
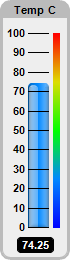
if (chartIndex == 0) {
// Add a blue (0x0088ff) bar from 0 to value with glass effect and 4 pixel rounded
// corners
m.addBar(0, value, 0x0088ff, Chart.glassEffect(Chart.NormalGlare, Chart.Left), 4);
// Add a 6-pixel thick smooth color scale at x = 53 (right of meter scale)
m.addColorScale(smoothColorScale, 53, 6);
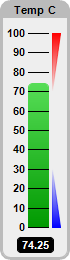
} else if (chartIndex == 1) {
// Add a green (0x00cc00) bar from 0 to value with bar lighting effect and 4 pixel
// rounded corners
m.addBar(0, value, 0x00cc00, Chart.barLighting(), 4);
// Add a high only color scale at x = 52 (right of meter scale) with thickness
// varying from 0 to 8
m.addColorScale(highColorScale, 52, 0, 52, 8);
// Add a low only color scale at x = 52 (right of meter scale) with thickness
// varying from 8 to 0
m.addColorScale(lowColorScale, 52, 8, 52, 0);
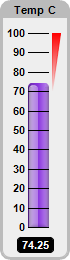
} else if (chartIndex == 2) {
// Add a purple (0x0088ff) bar from 0 to value with glass effect and 4 pixel rounded
// corners
m.addBar(0, value, 0x8833dd, Chart.glassEffect(Chart.NormalGlare, Chart.Left), 4);
// Add a high only color scale at x = 52 (right of meter scale) with thickness
// varying from 0 to 8
m.addColorScale(highColorScale, 52, 0, 52, 8);
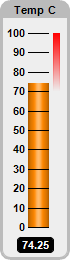
} else if (chartIndex == 3) {
// Add a orange (0xff8800) bar from 0 to value with cylinder lighting effect
m.addBar(0, value, 0xff8800, Chart.cylinderEffect());
// Add a high only color scale at x = 53 (right of meter scale)
m.addColorScale(highColorScale, 53, 6);
} else if (chartIndex == 4) {
// Add a red (0xee3333) bar from 0 to value with glass effect and 4 pixel rounded
// corners
m.addBar(0, value, 0xee3333, Chart.glassEffect(Chart.NormalGlare, Chart.Left), 4);
// Add a step color scale at x = 53 (right of meter scale)
m.addColorScale(stepColorScale, 53, 6);
} else {
// Add a grey (0xaaaaaa) bar from 0 to value
m.addBar(0, value, 0xaaaaaa);
// Add a smooth color scale at x = 52 (right of meter scale) with thickness varying
// from 0 to 8
m.addColorScale(smoothColorScale, 52, 0, 52, 8);
}
// Add a title using 8pt Arial Bold font with grey (0xbbbbbb) background
m.addTitle("Temp C", "Arial Bold", 8, Chart.TextColor).setBackground(0xbbbbbb);
// Add a text box at the bottom-center. Display the value using white (0xffffff) 8pt
// Arial Bold font on a black (0x000000) background with rounded border.
ChartDirector.TextBox t = m.addText(m.getWidth() / 2, m.getHeight() - 8, m.formatValue(
value, "2"), "Arial Bold", 8, 0xffffff, Chart.Bottom);
t.setBackground(0x000000);
t.setRoundedCorners(3);
t.setMargin2(5, 5, 2, 1);
// Output the chart
viewer.Chart = m;
}
}
}Imports System
Imports Microsoft.VisualBasic
Imports ChartDirector
Public Class whitevbarmeter
Implements DemoModule
'Name of demo module
Public Function getName() As String Implements DemoModule.getName
Return "White Vertical Bar Meters"
End Function
'Number of charts produced in this demo module
Public Function getNoOfCharts() As Integer Implements DemoModule.getNoOfCharts
Return 6
End Function
'Main code for creating charts
Public Sub createChart(viewer As WinChartViewer, chartIndex As Integer) _
Implements DemoModule.createChart
' The value to display on the meter
Dim value As Double = 74.25
' Create a LinearMeter object of size 70 x 260 pixels with very light grey (0xeeeeee)
' backgruond and a grey (0xbbbbbb) 3-pixel thick rounded frame
Dim m As LinearMeter = New LinearMeter(70, 260, &Heeeeee, &Hbbbbbb)
m.setRoundedFrame(Chart.Transparent)
m.setThickFrame(3)
' Set the scale region top-left corner at (28, 33), with size of 20 x 194 pixels. The scale
' labels are located on the left (default - implies vertical meter).
m.setMeter(28, 33, 20, 194)
' Set meter scale from 0 - 100, with a tick every 10 units
m.setScale(0, 100, 10)
' Demostrate different types of color scales
Dim smoothColorScale() As Double = {0, &H0000ff, 25, &H0088ff, 50, &H00ff00, 75, &Hdddd00, _
100, &Hff0000}
Dim stepColorScale() As Double = {0, &H00dd00, 50, &Hffff00, 80, &Hff0000, 100}
Dim highColorScale() As Double = {70, Chart.Transparent, 100, &Hff0000}
Dim lowColorScale() As Double = {0, &H0000ff, 30, Chart.Transparent}
If chartIndex = 0 Then
' Add a blue (0x0088ff) bar from 0 to value with glass effect and 4 pixel rounded
' corners
m.addBar(0, value, &H0088ff, Chart.glassEffect(Chart.NormalGlare, Chart.Left), 4)
' Add a 6-pixel thick smooth color scale at x = 53 (right of meter scale)
m.addColorScale(smoothColorScale, 53, 6)
ElseIf chartIndex = 1 Then
' Add a green (0x00cc00) bar from 0 to value with bar lighting effect and 4 pixel
' rounded corners
m.addBar(0, value, &H00cc00, Chart.barLighting(), 4)
' Add a high only color scale at x = 52 (right of meter scale) with thickness varying
' from 0 to 8
m.addColorScale(highColorScale, 52, 0, 52, 8)
' Add a low only color scale at x = 52 (right of meter scale) with thickness varying
' from 8 to 0
m.addColorScale(lowColorScale, 52, 8, 52, 0)
ElseIf chartIndex = 2 Then
' Add a purple (0x0088ff) bar from 0 to value with glass effect and 4 pixel rounded
' corners
m.addBar(0, value, &H8833dd, Chart.glassEffect(Chart.NormalGlare, Chart.Left), 4)
' Add a high only color scale at x = 52 (right of meter scale) with thickness varying
' from 0 to 8
m.addColorScale(highColorScale, 52, 0, 52, 8)
ElseIf chartIndex = 3 Then
' Add a orange (0xff8800) bar from 0 to value with cylinder lighting effect
m.addBar(0, value, &Hff8800, Chart.cylinderEffect())
' Add a high only color scale at x = 53 (right of meter scale)
m.addColorScale(highColorScale, 53, 6)
ElseIf chartIndex = 4 Then
' Add a red (0xee3333) bar from 0 to value with glass effect and 4 pixel rounded corners
m.addBar(0, value, &Hee3333, Chart.glassEffect(Chart.NormalGlare, Chart.Left), 4)
' Add a step color scale at x = 53 (right of meter scale)
m.addColorScale(stepColorScale, 53, 6)
Else
' Add a grey (0xaaaaaa) bar from 0 to value
m.addBar(0, value, &Haaaaaa)
' Add a smooth color scale at x = 52 (right of meter scale) with thickness varying from
' 0 to 8
m.addColorScale(smoothColorScale, 52, 0, 52, 8)
End If
' Add a title using 8pt Arial Bold font with grey (0xbbbbbb) background
m.addTitle("Temp C", "Arial Bold", 8, Chart.TextColor).setBackground(&Hbbbbbb)
' Add a text box at the bottom-center. Display the value using white (0xffffff) 8pt Arial
' Bold font on a black (0x000000) background with rounded border.
Dim t As ChartDirector.TextBox = m.addText(m.getWidth() / 2, m.getHeight() - 8, _
m.formatValue(value, "2"), "Arial Bold", 8, &Hffffff, Chart.Bottom)
t.setBackground(&H000000)
t.setRoundedCorners(3)
t.setMargin2(5, 5, 2, 1)
' Output the chart
viewer.Chart = m
End Sub
End Classusing System;
using ChartDirector;
namespace CSharpWPFCharts
{
public class whitevbarmeter : DemoModule
{
//Name of demo module
public string getName() { return "White Vertical Bar Meters"; }
//Number of charts produced in this demo module
public int getNoOfCharts() { return 6; }
//Main code for creating charts
public void createChart(WPFChartViewer viewer, int chartIndex)
{
// The value to display on the meter
double value = 74.25;
// Create a LinearMeter object of size 70 x 260 pixels with very light grey (0xeeeeee)
// backgruond and a grey (0xbbbbbb) 3-pixel thick rounded frame
LinearMeter m = new LinearMeter(70, 260, 0xeeeeee, 0xbbbbbb);
m.setRoundedFrame(Chart.Transparent);
m.setThickFrame(3);
// Set the scale region top-left corner at (28, 33), with size of 20 x 194 pixels. The
// scale labels are located on the left (default - implies vertical meter).
m.setMeter(28, 33, 20, 194);
// Set meter scale from 0 - 100, with a tick every 10 units
m.setScale(0, 100, 10);
// Demostrate different types of color scales
double[] smoothColorScale = {0, 0x0000ff, 25, 0x0088ff, 50, 0x00ff00, 75, 0xdddd00, 100,
0xff0000};
double[] stepColorScale = {0, 0x00dd00, 50, 0xffff00, 80, 0xff0000, 100};
double[] highColorScale = {70, Chart.Transparent, 100, 0xff0000};
double[] lowColorScale = {0, 0x0000ff, 30, Chart.Transparent};
if (chartIndex == 0) {
// Add a blue (0x0088ff) bar from 0 to value with glass effect and 4 pixel rounded
// corners
m.addBar(0, value, 0x0088ff, Chart.glassEffect(Chart.NormalGlare, Chart.Left), 4);
// Add a 6-pixel thick smooth color scale at x = 53 (right of meter scale)
m.addColorScale(smoothColorScale, 53, 6);
} else if (chartIndex == 1) {
// Add a green (0x00cc00) bar from 0 to value with bar lighting effect and 4 pixel
// rounded corners
m.addBar(0, value, 0x00cc00, Chart.barLighting(), 4);
// Add a high only color scale at x = 52 (right of meter scale) with thickness
// varying from 0 to 8
m.addColorScale(highColorScale, 52, 0, 52, 8);
// Add a low only color scale at x = 52 (right of meter scale) with thickness
// varying from 8 to 0
m.addColorScale(lowColorScale, 52, 8, 52, 0);
} else if (chartIndex == 2) {
// Add a purple (0x0088ff) bar from 0 to value with glass effect and 4 pixel rounded
// corners
m.addBar(0, value, 0x8833dd, Chart.glassEffect(Chart.NormalGlare, Chart.Left), 4);
// Add a high only color scale at x = 52 (right of meter scale) with thickness
// varying from 0 to 8
m.addColorScale(highColorScale, 52, 0, 52, 8);
} else if (chartIndex == 3) {
// Add a orange (0xff8800) bar from 0 to value with cylinder lighting effect
m.addBar(0, value, 0xff8800, Chart.cylinderEffect());
// Add a high only color scale at x = 53 (right of meter scale)
m.addColorScale(highColorScale, 53, 6);
} else if (chartIndex == 4) {
// Add a red (0xee3333) bar from 0 to value with glass effect and 4 pixel rounded
// corners
m.addBar(0, value, 0xee3333, Chart.glassEffect(Chart.NormalGlare, Chart.Left), 4);
// Add a step color scale at x = 53 (right of meter scale)
m.addColorScale(stepColorScale, 53, 6);
} else {
// Add a grey (0xaaaaaa) bar from 0 to value
m.addBar(0, value, 0xaaaaaa);
// Add a smooth color scale at x = 52 (right of meter scale) with thickness varying
// from 0 to 8
m.addColorScale(smoothColorScale, 52, 0, 52, 8);
}
// Add a title using 8pt Arial Bold font with grey (0xbbbbbb) background
m.addTitle("Temp C", "Arial Bold", 8, Chart.TextColor).setBackground(0xbbbbbb);
// Add a text box at the bottom-center. Display the value using white (0xffffff) 8pt
// Arial Bold font on a black (0x000000) background with rounded border.
ChartDirector.TextBox t = m.addText(m.getWidth() / 2, m.getHeight() - 8, m.formatValue(
value, "2"), "Arial Bold", 8, 0xffffff, Chart.Bottom);
t.setBackground(0x000000);
t.setRoundedCorners(3);
t.setMargin2(5, 5, 2, 1);
// Output the chart
viewer.Chart = m;
}
}
}<%@ Page Language="C#" Debug="true" %>
<%@ Import Namespace="ChartDirector" %>
<%@ Register TagPrefix="chart" Namespace="ChartDirector" Assembly="netchartdir" %>
<!DOCTYPE html>
<script runat="server">
//
// Create chart
//
protected void createChart(WebChartViewer viewer, int chartIndex)
{
// The value to display on the meter
double value = 74.25;
// Create a LinearMeter object of size 70 x 260 pixels with very light grey (0xeeeeee)
// backgruond and a grey (0xbbbbbb) 3-pixel thick rounded frame
LinearMeter m = new LinearMeter(70, 260, 0xeeeeee, 0xbbbbbb);
m.setRoundedFrame(Chart.Transparent);
m.setThickFrame(3);
// Set the scale region top-left corner at (28, 33), with size of 20 x 194 pixels. The scale
// labels are located on the left (default - implies vertical meter).
m.setMeter(28, 33, 20, 194);
// Set meter scale from 0 - 100, with a tick every 10 units
m.setScale(0, 100, 10);
// Demostrate different types of color scales
double[] smoothColorScale = {0, 0x0000ff, 25, 0x0088ff, 50, 0x00ff00, 75, 0xdddd00, 100,
0xff0000};
double[] stepColorScale = {0, 0x00dd00, 50, 0xffff00, 80, 0xff0000, 100};
double[] highColorScale = {70, Chart.Transparent, 100, 0xff0000};
double[] lowColorScale = {0, 0x0000ff, 30, Chart.Transparent};
if (chartIndex == 0) {
// Add a blue (0x0088ff) bar from 0 to value with glass effect and 4 pixel rounded corners
m.addBar(0, value, 0x0088ff, Chart.glassEffect(Chart.NormalGlare, Chart.Left), 4);
// Add a 6-pixel thick smooth color scale at x = 53 (right of meter scale)
m.addColorScale(smoothColorScale, 53, 6);
} else if (chartIndex == 1) {
// Add a green (0x00cc00) bar from 0 to value with bar lighting effect and 4 pixel rounded
// corners
m.addBar(0, value, 0x00cc00, Chart.barLighting(), 4);
// Add a high only color scale at x = 52 (right of meter scale) with thickness varying from
// 0 to 8
m.addColorScale(highColorScale, 52, 0, 52, 8);
// Add a low only color scale at x = 52 (right of meter scale) with thickness varying from 8
// to 0
m.addColorScale(lowColorScale, 52, 8, 52, 0);
} else if (chartIndex == 2) {
// Add a purple (0x0088ff) bar from 0 to value with glass effect and 4 pixel rounded corners
m.addBar(0, value, 0x8833dd, Chart.glassEffect(Chart.NormalGlare, Chart.Left), 4);
// Add a high only color scale at x = 52 (right of meter scale) with thickness varying from
// 0 to 8
m.addColorScale(highColorScale, 52, 0, 52, 8);
} else if (chartIndex == 3) {
// Add a orange (0xff8800) bar from 0 to value with cylinder lighting effect
m.addBar(0, value, 0xff8800, Chart.cylinderEffect());
// Add a high only color scale at x = 53 (right of meter scale)
m.addColorScale(highColorScale, 53, 6);
} else if (chartIndex == 4) {
// Add a red (0xee3333) bar from 0 to value with glass effect and 4 pixel rounded corners
m.addBar(0, value, 0xee3333, Chart.glassEffect(Chart.NormalGlare, Chart.Left), 4);
// Add a step color scale at x = 53 (right of meter scale)
m.addColorScale(stepColorScale, 53, 6);
} else {
// Add a grey (0xaaaaaa) bar from 0 to value
m.addBar(0, value, 0xaaaaaa);
// Add a smooth color scale at x = 52 (right of meter scale) with thickness varying from 0
// to 8
m.addColorScale(smoothColorScale, 52, 0, 52, 8);
}
// Add a title using 8pt Arial Bold font with grey (0xbbbbbb) background
m.addTitle("Temp C", "Arial Bold", 8, Chart.TextColor).setBackground(0xbbbbbb);
// Add a text box at the bottom-center. Display the value using white (0xffffff) 8pt Arial Bold
// font on a black (0x000000) background with rounded border.
ChartDirector.TextBox t = m.addText(m.getWidth() / 2, m.getHeight() - 8, m.formatValue(value,
"2"), "Arial Bold", 8, 0xffffff, Chart.Bottom);
t.setBackground(0x000000);
t.setRoundedCorners(3);
t.setMargin2(5, 5, 2, 1);
// Output the chart
viewer.Image = m.makeWebImage(Chart.SVG);
}
//
// Page Load event handler
//
protected void Page_Load(object sender, EventArgs e)
{
createChart(WebChartViewer0, 0);
createChart(WebChartViewer1, 1);
createChart(WebChartViewer2, 2);
createChart(WebChartViewer3, 3);
createChart(WebChartViewer4, 4);
createChart(WebChartViewer5, 5);
}
</script>
<html>
<head>
<script type="text/javascript" src="cdjcv.js"></script>
</head>
<body>
<chart:WebChartViewer id="WebChartViewer0" runat="server" style='margin-right:25px;' />
<chart:WebChartViewer id="WebChartViewer1" runat="server" style='margin-right:25px;' />
<chart:WebChartViewer id="WebChartViewer2" runat="server" style='margin-right:25px;' />
<chart:WebChartViewer id="WebChartViewer3" runat="server" style='margin-right:25px;' />
<chart:WebChartViewer id="WebChartViewer4" runat="server" style='margin-right:25px;' />
<chart:WebChartViewer id="WebChartViewer5" runat="server" />
</body>
</html><%@ Page Language="VB" Debug="true" %>
<%@ Import Namespace="ChartDirector" %>
<%@ Register TagPrefix="chart" Namespace="ChartDirector" Assembly="netchartdir" %>
<!DOCTYPE html>
<script runat="server">
'
' Create chart
'
Protected Sub createChart(viewer As WebChartViewer, chartIndex As Integer)
' The value to display on the meter
Dim value As Double = 74.25
' Create a LinearMeter object of size 70 x 260 pixels with very light grey (0xeeeeee) backgruond
' and a grey (0xbbbbbb) 3-pixel thick rounded frame
Dim m As LinearMeter = New LinearMeter(70, 260, &Heeeeee, &Hbbbbbb)
m.setRoundedFrame(Chart.Transparent)
m.setThickFrame(3)
' Set the scale region top-left corner at (28, 33), with size of 20 x 194 pixels. The scale
' labels are located on the left (default - implies vertical meter).
m.setMeter(28, 33, 20, 194)
' Set meter scale from 0 - 100, with a tick every 10 units
m.setScale(0, 100, 10)
' Demostrate different types of color scales
Dim smoothColorScale() As Double = {0, &H0000ff, 25, &H0088ff, 50, &H00ff00, 75, &Hdddd00, _
100, &Hff0000}
Dim stepColorScale() As Double = {0, &H00dd00, 50, &Hffff00, 80, &Hff0000, 100}
Dim highColorScale() As Double = {70, Chart.Transparent, 100, &Hff0000}
Dim lowColorScale() As Double = {0, &H0000ff, 30, Chart.Transparent}
If chartIndex = 0 Then
' Add a blue (0x0088ff) bar from 0 to value with glass effect and 4 pixel rounded corners
m.addBar(0, value, &H0088ff, Chart.glassEffect(Chart.NormalGlare, Chart.Left), 4)
' Add a 6-pixel thick smooth color scale at x = 53 (right of meter scale)
m.addColorScale(smoothColorScale, 53, 6)
ElseIf chartIndex = 1 Then
' Add a green (0x00cc00) bar from 0 to value with bar lighting effect and 4 pixel rounded
' corners
m.addBar(0, value, &H00cc00, Chart.barLighting(), 4)
' Add a high only color scale at x = 52 (right of meter scale) with thickness varying from 0
' to 8
m.addColorScale(highColorScale, 52, 0, 52, 8)
' Add a low only color scale at x = 52 (right of meter scale) with thickness varying from 8
' to 0
m.addColorScale(lowColorScale, 52, 8, 52, 0)
ElseIf chartIndex = 2 Then
' Add a purple (0x0088ff) bar from 0 to value with glass effect and 4 pixel rounded corners
m.addBar(0, value, &H8833dd, Chart.glassEffect(Chart.NormalGlare, Chart.Left), 4)
' Add a high only color scale at x = 52 (right of meter scale) with thickness varying from 0
' to 8
m.addColorScale(highColorScale, 52, 0, 52, 8)
ElseIf chartIndex = 3 Then
' Add a orange (0xff8800) bar from 0 to value with cylinder lighting effect
m.addBar(0, value, &Hff8800, Chart.cylinderEffect())
' Add a high only color scale at x = 53 (right of meter scale)
m.addColorScale(highColorScale, 53, 6)
ElseIf chartIndex = 4 Then
' Add a red (0xee3333) bar from 0 to value with glass effect and 4 pixel rounded corners
m.addBar(0, value, &Hee3333, Chart.glassEffect(Chart.NormalGlare, Chart.Left), 4)
' Add a step color scale at x = 53 (right of meter scale)
m.addColorScale(stepColorScale, 53, 6)
Else
' Add a grey (0xaaaaaa) bar from 0 to value
m.addBar(0, value, &Haaaaaa)
' Add a smooth color scale at x = 52 (right of meter scale) with thickness varying from 0 to
' 8
m.addColorScale(smoothColorScale, 52, 0, 52, 8)
End If
' Add a title using 8pt Arial Bold font with grey (0xbbbbbb) background
m.addTitle("Temp C", "Arial Bold", 8, Chart.TextColor).setBackground(&Hbbbbbb)
' Add a text box at the bottom-center. Display the value using white (0xffffff) 8pt Arial Bold
' font on a black (0x000000) background with rounded border.
Dim t As ChartDirector.TextBox = m.addText(m.getWidth() / 2, m.getHeight() - 8, m.formatValue( _
value, "2"), "Arial Bold", 8, &Hffffff, Chart.Bottom)
t.setBackground(&H000000)
t.setRoundedCorners(3)
t.setMargin2(5, 5, 2, 1)
' Output the chart
viewer.Image = m.makeWebImage(Chart.SVG)
End Sub
'
' Page Load event handler
'
Protected Sub Page_Load(ByVal sender As System.Object, ByVal e As System.EventArgs)
createChart(WebChartViewer0, 0)
createChart(WebChartViewer1, 1)
createChart(WebChartViewer2, 2)
createChart(WebChartViewer3, 3)
createChart(WebChartViewer4, 4)
createChart(WebChartViewer5, 5)
End Sub
</script>
<html>
<head>
<script type="text/javascript" src="cdjcv.js"></script>
</head>
<body>
<chart:WebChartViewer id="WebChartViewer0" runat="server" style='margin-right:25px;' />
<chart:WebChartViewer id="WebChartViewer1" runat="server" style='margin-right:25px;' />
<chart:WebChartViewer id="WebChartViewer2" runat="server" style='margin-right:25px;' />
<chart:WebChartViewer id="WebChartViewer3" runat="server" style='margin-right:25px;' />
<chart:WebChartViewer id="WebChartViewer4" runat="server" style='margin-right:25px;' />
<chart:WebChartViewer id="WebChartViewer5" runat="server" />
</body>
</html>using System;
using System.Web.Mvc;
using ChartDirector;
namespace NetMvcCharts.Controllers
{
public class WhitevbarmeterController : Controller
{
//
// Default Action
//
public ActionResult Index()
{
ViewBag.Title = "White Vertical Bar Meters";
// This example contains 6 charts.
ViewBag.Viewer = new RazorChartViewer[6];
for (int i = 0; i < ViewBag.Viewer.Length; ++i)
createChart(ViewBag.Viewer[i] = new RazorChartViewer(HttpContext, "chart" + i), i);
return View("~/Views/Shared/ChartView.cshtml");
}
//
// Create chart
//
private void createChart(RazorChartViewer viewer, int chartIndex)
{
// The value to display on the meter
double value = 74.25;
// Create a LinearMeter object of size 70 x 260 pixels with very light grey (0xeeeeee)
// backgruond and a grey (0xbbbbbb) 3-pixel thick rounded frame
LinearMeter m = new LinearMeter(70, 260, 0xeeeeee, 0xbbbbbb);
m.setRoundedFrame(Chart.Transparent);
m.setThickFrame(3);
// Set the scale region top-left corner at (28, 33), with size of 20 x 194 pixels. The scale
// labels are located on the left (default - implies vertical meter).
m.setMeter(28, 33, 20, 194);
// Set meter scale from 0 - 100, with a tick every 10 units
m.setScale(0, 100, 10);
// Demostrate different types of color scales
double[] smoothColorScale = {0, 0x0000ff, 25, 0x0088ff, 50, 0x00ff00, 75, 0xdddd00, 100,
0xff0000};
double[] stepColorScale = {0, 0x00dd00, 50, 0xffff00, 80, 0xff0000, 100};
double[] highColorScale = {70, Chart.Transparent, 100, 0xff0000};
double[] lowColorScale = {0, 0x0000ff, 30, Chart.Transparent};
if (chartIndex == 0) {
// Add a blue (0x0088ff) bar from 0 to value with glass effect and 4 pixel rounded
// corners
m.addBar(0, value, 0x0088ff, Chart.glassEffect(Chart.NormalGlare, Chart.Left), 4);
// Add a 6-pixel thick smooth color scale at x = 53 (right of meter scale)
m.addColorScale(smoothColorScale, 53, 6);
} else if (chartIndex == 1) {
// Add a green (0x00cc00) bar from 0 to value with bar lighting effect and 4 pixel
// rounded corners
m.addBar(0, value, 0x00cc00, Chart.barLighting(), 4);
// Add a high only color scale at x = 52 (right of meter scale) with thickness varying
// from 0 to 8
m.addColorScale(highColorScale, 52, 0, 52, 8);
// Add a low only color scale at x = 52 (right of meter scale) with thickness varying
// from 8 to 0
m.addColorScale(lowColorScale, 52, 8, 52, 0);
} else if (chartIndex == 2) {
// Add a purple (0x0088ff) bar from 0 to value with glass effect and 4 pixel rounded
// corners
m.addBar(0, value, 0x8833dd, Chart.glassEffect(Chart.NormalGlare, Chart.Left), 4);
// Add a high only color scale at x = 52 (right of meter scale) with thickness varying
// from 0 to 8
m.addColorScale(highColorScale, 52, 0, 52, 8);
} else if (chartIndex == 3) {
// Add a orange (0xff8800) bar from 0 to value with cylinder lighting effect
m.addBar(0, value, 0xff8800, Chart.cylinderEffect());
// Add a high only color scale at x = 53 (right of meter scale)
m.addColorScale(highColorScale, 53, 6);
} else if (chartIndex == 4) {
// Add a red (0xee3333) bar from 0 to value with glass effect and 4 pixel rounded corners
m.addBar(0, value, 0xee3333, Chart.glassEffect(Chart.NormalGlare, Chart.Left), 4);
// Add a step color scale at x = 53 (right of meter scale)
m.addColorScale(stepColorScale, 53, 6);
} else {
// Add a grey (0xaaaaaa) bar from 0 to value
m.addBar(0, value, 0xaaaaaa);
// Add a smooth color scale at x = 52 (right of meter scale) with thickness varying from
// 0 to 8
m.addColorScale(smoothColorScale, 52, 0, 52, 8);
}
// Add a title using 8pt Arial Bold font with grey (0xbbbbbb) background
m.addTitle("Temp C", "Arial Bold", 8, Chart.TextColor).setBackground(0xbbbbbb);
// Add a text box at the bottom-center. Display the value using white (0xffffff) 8pt Arial
// Bold font on a black (0x000000) background with rounded border.
ChartDirector.TextBox t = m.addText(m.getWidth() / 2, m.getHeight() - 8, m.formatValue(value,
"2"), "Arial Bold", 8, 0xffffff, Chart.Bottom);
t.setBackground(0x000000);
t.setRoundedCorners(3);
t.setMargin2(5, 5, 2, 1);
// Output the chart
viewer.Image = m.makeWebImage(Chart.SVG);
}
}
}@{ Layout = null; }
<!DOCTYPE html>
<html>
<head>
<meta name="viewport" content="width=device-width" />
<title>@ViewBag.Title</title>
<style>
@ViewBag.Style
</style>
@Scripts.Render("~/Scripts/cdjcv.js")
</head>
<body style="margin:5px 0px 0px 5px">
<div style="font:bold 18pt verdana;">
@ViewBag.Title
</div>
<hr style="border:solid 1px #000080; background:#000080" />
<div>
@{
if (ViewBag.Viewer is Array)
{
// Display multiple charts
for (int i = 0; i < ViewBag.Viewer.Length; ++i)
{
@:@Html.Raw(ViewBag.Viewer[i].RenderHTML())
}
}
else
{
// Display one chart only
@:@Html.Raw(ViewBag.Viewer.RenderHTML())
}
}
</div>
</body>
</html>