[Windows Forms - C# version] NetWinCharts\CSharpWinCharts\xzonecolor.cs
using System;
using ChartDirector;
namespace CSharpChartExplorer
{
public class xzonecolor : DemoModule
{
//Name of demo module
public string getName() { return "X Zone Coloring"; }
//Number of charts produced in this demo module
public int getNoOfCharts() { return 1; }
//Main code for creating chart.
//Note: the argument chartIndex is unused because this demo only has 1 chart.
public void createChart(WinChartViewer viewer, int chartIndex)
{
// The data for the chart
double[] data = {50, 55, 47, 34, 42, 49, 63, 62, 73, 59, 56, 50, 64, 60, 67, 67, 58, 59,
73, 77, 84, 82, 80, 84, 89};
// The error data representing the error band around the data points
double[] errData = {5, 6, 5.1, 6.5, 6.6, 8, 5.4, 5.1, 4.6, 5.0, 5.2, 6.0, 4.9, 5.6, 4.8,
6.2, 7.4, 7.1, 6.5, 9.6, 12.1, 15.3, 18.5, 20.9, 24.1};
// The timestamps for the data
DateTime[] labels = {new DateTime(2001, 1, 1), new DateTime(2001, 2, 1), new DateTime(
2001, 3, 1), new DateTime(2001, 4, 1), new DateTime(2001, 5, 1), new DateTime(2001,
6, 1), new DateTime(2001, 7, 1), new DateTime(2001, 8, 1), new DateTime(2001, 9, 1),
new DateTime(2001, 10, 1), new DateTime(2001, 11, 1), new DateTime(2001, 12, 1),
new DateTime(2002, 1, 1), new DateTime(2002, 2, 1), new DateTime(2002, 3, 1),
new DateTime(2002, 4, 1), new DateTime(2002, 5, 1), new DateTime(2002, 6, 1),
new DateTime(2002, 7, 1), new DateTime(2002, 8, 1), new DateTime(2002, 9, 1),
new DateTime(2002, 10, 1), new DateTime(2002, 11, 1), new DateTime(2002, 12, 1),
new DateTime(2003, 1, 1)};
// Create a XYChart object of size 550 x 220 pixels
XYChart c = new XYChart(550, 220);
// Set the plot area at (50, 10) and of size 480 x 180 pixels. Enabled both vertical and
// horizontal grids by setting their colors to light grey (cccccc)
c.setPlotArea(50, 10, 480, 180).setGridColor(0xcccccc, 0xcccccc);
// Add a legend box (50, 10) (top of plot area) using horizontal layout. Use 8pt Arial
// font. Disable bounding box (set border to transparent).
LegendBox legendBox = c.addLegend(50, 10, false, "", 8);
legendBox.setBackground(Chart.Transparent);
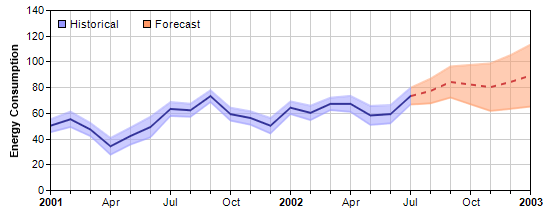
// Add keys to the legend box to explain the color zones
legendBox.addKey("Historical", 0x9999ff);
legendBox.addKey("Forecast", 0xff9966);
// Add a title to the y axis.
c.yAxis().setTitle("Energy Consumption");
// Set the labels on the x axis
c.xAxis().setLabels2(labels);
// Set multi-style axis label formatting. Use Arial Bold font for yearly labels and
// display them as "yyyy". Use default font for monthly labels and display them as
// "mmm". Replace some labels with minor ticks to ensure the labels are at least 3 units
// apart.
c.xAxis().setMultiFormat(Chart.StartOfYearFilter(), "<*font=Arial Bold*>{value|yyyy}",
Chart.StartOfMonthFilter(), "{value|mmm}", 3);
// Add a line layer to the chart
LineLayer layer = c.addLineLayer2();
// Create the color to draw the data line. The line is blue (0x333399) to the left of x
// = 18, and become a red (0xd04040) dash line to the right of x = 18.
int lineColor = layer.xZoneColor(18, 0x333399, c.dashLineColor(0xd04040, Chart.DashLine)
);
// Add the data line
layer.addDataSet(data, lineColor, "Average");
// We are not showing the data set name in the legend box. The name is for showing in
// tool tips only.
layer.setLegend(Chart.NoLegend);
// Create the color to draw the err zone. The color is semi-transparent blue
// (0x809999ff) to the left of x = 18, and become semi-transparent red (0x80ff9966) to
// the right of x = 18.
int errColor = layer.xZoneColor(18, unchecked((int)0x809999ff),
unchecked((int)0x80ff9966));
// Add the upper border of the err zone
layer.addDataSet(new ArrayMath(data).add(errData).result(), errColor, "Upper bound");
// Add the lower border of the err zone
layer.addDataSet(new ArrayMath(data).sub(errData).result(), errColor, "Lower bound");
// Set the default line width to 2 pixels
layer.setLineWidth(2);
// In this example, we are not showing the data set name in the legend box
layer.setLegend(Chart.NoLegend);
// Color the region between the err zone lines
c.addInterLineLayer(layer.getLine(1), layer.getLine(2), errColor);
// Output the chart
viewer.Chart = c;
// Include tool tip for the chart.
viewer.ImageMap = c.getHTMLImageMap("clickable", "",
"title='{dataSetName} on {xLabel|mmm yyyy}: {value} MJoule'");
}
}
}
[Windows Forms - VB Version] NetWinCharts\VBNetWinCharts\xzonecolor.vb
Imports System
Imports Microsoft.VisualBasic
Imports ChartDirector

Public Class xzonecolor
    Implements DemoModule

    'Name of demo module
    Public Function getName() As String Implements DemoModule.getName
        Return "X Zone Coloring"
    End Function

    'Number of charts produced in this demo module
    Public Function getNoOfCharts() As Integer Implements DemoModule.getNoOfCharts
        Return 1
    End Function

    'Main code for creating chart.
    'Note: the argument chartIndex is unused because this demo only has 1 chart.
    Public Sub createChart(viewer As WinChartViewer, chartIndex As Integer) _
        Implements DemoModule.createChart

        ' The data for the chart
        Dim data() As Double = {50, 55, 47, 34, 42, 49, 63, 62, 73, 59, 56, 50, 64, 60, 67, 67, _
            58, 59, 73, 77, 84, 82, 80, 84, 89}

        ' The error data representing the error band around the data points
        Dim errData() As Double = {5, 6, 5.1, 6.5, 6.6, 8, 5.4, 5.1, 4.6, 5.0, 5.2, 6.0, 4.9, 5.6, _
            4.8, 6.2, 7.4, 7.1, 6.5, 9.6, 12.1, 15.3, 18.5, 20.9, 24.1}

        ' The timestamps for the data
        Dim labels() As Date = {DateSerial(2001, 1, 1), DateSerial(2001, 2, 1), DateSerial(2001, _
            3, 1), DateSerial(2001, 4, 1), DateSerial(2001, 5, 1), DateSerial(2001, 6, 1), _
            DateSerial(2001, 7, 1), DateSerial(2001, 8, 1), DateSerial(2001, 9, 1), DateSerial( _
            2001, 10, 1), DateSerial(2001, 11, 1), DateSerial(2001, 12, 1), DateSerial(2002, 1, 1 _
            ), DateSerial(2002, 2, 1), DateSerial(2002, 3, 1), DateSerial(2002, 4, 1), DateSerial( _
            2002, 5, 1), DateSerial(2002, 6, 1), DateSerial(2002, 7, 1), DateSerial(2002, 8, 1), _
            DateSerial(2002, 9, 1), DateSerial(2002, 10, 1), DateSerial(2002, 11, 1), DateSerial( _
            2002, 12, 1), DateSerial(2003, 1, 1)}

        ' Create a XYChart object of size 550 x 220 pixels
        Dim c As XYChart = New XYChart(550, 220)

        ' Set the plot area at (50, 10) and of size 480 x 180 pixels. Enabled both vertical and
        ' horizontal grids by setting their colors to light grey (cccccc)
        c.setPlotArea(50, 10, 480, 180).setGridColor(&Hcccccc, &Hcccccc)

        ' Add a legend box (50, 10) (top of plot area) using horizontal layout. Use 8pt Arial font.
        ' Disable bounding box (set border to transparent).
        Dim legendBox As LegendBox = c.addLegend(50, 10, False, "", 8)
        legendBox.setBackground(Chart.Transparent)

        ' Add keys to the legend box to explain the color zones
        legendBox.addKey("Historical", &H9999ff)
        legendBox.addKey("Forecast", &Hff9966)

        ' Add a title to the y axis.
        c.yAxis().setTitle("Energy Consumption")

        ' Set the labels on the x axis
        c.xAxis().setLabels2(labels)

        ' Set multi-style axis label formatting. Use Arial Bold font for yearly labels and display
        ' them as "yyyy". Use default font for monthly labels and display them as "mmm". Replace
        ' some labels with minor ticks to ensure the labels are at least 3 units apart.
        c.xAxis().setMultiFormat(Chart.StartOfYearFilter(), "<*font=Arial Bold*>{value|yyyy}", _
            Chart.StartOfMonthFilter(), "{value|mmm}", 3)

        ' Add a line layer to the chart
        Dim layer As LineLayer = c.addLineLayer2()

        ' Create the color to draw the data line. The line is blue (0x333399) to the left of x = 18,
        ' and become a red (0xd04040) dash line to the right of x = 18.
        Dim lineColor As Integer = layer.xZoneColor(18, &H333399, c.dashLineColor(&Hd04040, _
            Chart.DashLine))

        ' Add the data line
        layer.addDataSet(data, lineColor, "Average")

        ' We are not showing the data set name in the legend box. The name is for showing in tool
        ' tips only.
        layer.setLegend(Chart.NoLegend)

        ' Create the color to draw the err zone. The color is semi-transparent blue (0x809999ff) to
        ' the left of x = 18, and become semi-transparent red (0x80ff9966) to the right of x = 18.
        Dim errColor As Integer = layer.xZoneColor(18, &H809999ff, &H80ff9966)

        ' Add the upper border of the err zone
        layer.addDataSet(New ArrayMath(data).add(errData).result(), errColor, "Upper bound")

        ' Add the lower border of the err zone
        layer.addDataSet(New ArrayMath(data).sub(errData).result(), errColor, "Lower bound")

        ' Set the default line width to 2 pixels
        layer.setLineWidth(2)

        ' In this example, we are not showing the data set name in the legend box
        layer.setLegend(Chart.NoLegend)

        ' Color the region between the err zone lines
        c.addInterLineLayer(layer.getLine(1), layer.getLine(2), errColor)

        ' Output the chart
        viewer.Chart = c

        ' Include tool tip for the chart.
        viewer.ImageMap = c.getHTMLImageMap("clickable", "", _
            "title='{dataSetName} on {xLabel|mmm yyyy}: {value} MJoule'")

    End Sub

End Class
[WPF - C#] NetWPFCharts\CSharpWPFCharts\xzonecolor.cs
using System;
using ChartDirector;

namespace CSharpWPFCharts
{
    public class xzonecolor : DemoModule
    {
        //Name of demo module
        public string getName() { return "X Zone Coloring"; }

        //Number of charts produced in this demo module
        public int getNoOfCharts() { return 1; }

        //Main code for creating chart.
        //Note: the argument chartIndex is unused because this demo only has 1 chart.
        public void createChart(WPFChartViewer viewer, int chartIndex)
        {
            // The data for the chart
            double[] data = {50, 55, 47, 34, 42, 49, 63, 62, 73, 59, 56, 50, 64, 60, 67, 67, 58, 59,
                73, 77, 84, 82, 80, 84, 89};

            // The error data representing the error band around the data points
            double[] errData = {5, 6, 5.1, 6.5, 6.6, 8, 5.4, 5.1, 4.6, 5.0, 5.2, 6.0, 4.9, 5.6, 4.8,
                6.2, 7.4, 7.1, 6.5, 9.6, 12.1, 15.3, 18.5, 20.9, 24.1};

            // The timestamps for the data
            DateTime[] labels = {new DateTime(2001, 1, 1), new DateTime(2001, 2, 1), new DateTime(
                2001, 3, 1), new DateTime(2001, 4, 1), new DateTime(2001, 5, 1), new DateTime(2001,
                6, 1), new DateTime(2001, 7, 1), new DateTime(2001, 8, 1), new DateTime(2001, 9, 1),
                new DateTime(2001, 10, 1), new DateTime(2001, 11, 1), new DateTime(2001, 12, 1),
                new DateTime(2002, 1, 1), new DateTime(2002, 2, 1), new DateTime(2002, 3, 1),
                new DateTime(2002, 4, 1), new DateTime(2002, 5, 1), new DateTime(2002, 6, 1),
                new DateTime(2002, 7, 1), new DateTime(2002, 8, 1), new DateTime(2002, 9, 1),
                new DateTime(2002, 10, 1), new DateTime(2002, 11, 1), new DateTime(2002, 12, 1),
                new DateTime(2003, 1, 1)};

            // Create a XYChart object of size 550 x 220 pixels
            XYChart c = new XYChart(550, 220);

            // Set the plot area at (50, 10) and of size 480 x 180 pixels. Enabled both vertical and
            // horizontal grids by setting their colors to light grey (cccccc)
            c.setPlotArea(50, 10, 480, 180).setGridColor(0xcccccc, 0xcccccc);

            // Add a legend box (50, 10) (top of plot area) using horizontal layout. Use 8pt Arial
            // font. Disable bounding box (set border to transparent).
            LegendBox legendBox = c.addLegend(50, 10, false, "", 8);
            legendBox.setBackground(Chart.Transparent);

            // Add keys to the legend box to explain the color zones
            legendBox.addKey("Historical", 0x9999ff);
            legendBox.addKey("Forecast", 0xff9966);

            // Add a title to the y axis.
            c.yAxis().setTitle("Energy Consumption");

            // Set the labels on the x axis
            c.xAxis().setLabels2(labels);

            // Set multi-style axis label formatting. Use Arial Bold font for yearly labels and
            // display them as "yyyy". Use default font for monthly labels and display them as
            // "mmm". Replace some labels with minor ticks to ensure the labels are at least 3 units
            // apart.
            c.xAxis().setMultiFormat(Chart.StartOfYearFilter(), "<*font=Arial Bold*>{value|yyyy}",
                Chart.StartOfMonthFilter(), "{value|mmm}", 3);

            // Add a line layer to the chart
            LineLayer layer = c.addLineLayer2();

            // Create the color to draw the data line. The line is blue (0x333399) to the left of x
            // = 18, and become a red (0xd04040) dash line to the right of x = 18.
            int lineColor = layer.xZoneColor(18, 0x333399, c.dashLineColor(0xd04040, Chart.DashLine)
                );

            // Add the data line
            layer.addDataSet(data, lineColor, "Average");

            // We are not showing the data set name in the legend box. The name is for showing in
            // tool tips only.
            layer.setLegend(Chart.NoLegend);

            // Create the color to draw the err zone. The color is semi-transparent blue
            // (0x809999ff) to the left of x = 18, and become semi-transparent red (0x80ff9966) to
            // the right of x = 18.
            int errColor = layer.xZoneColor(18, unchecked((int)0x809999ff),
                unchecked((int)0x80ff9966));

            // Add the upper border of the err zone
            layer.addDataSet(new ArrayMath(data).add(errData).result(), errColor, "Upper bound");

            // Add the lower border of the err zone
            layer.addDataSet(new ArrayMath(data).sub(errData).result(), errColor, "Lower bound");

            // Set the default line width to 2 pixels
            layer.setLineWidth(2);

            // In this example, we are not showing the data set name in the legend box
            layer.setLegend(Chart.NoLegend);

            // Color the region between the err zone lines
            c.addInterLineLayer(layer.getLine(1), layer.getLine(2), errColor);

            // Output the chart
            viewer.Chart = c;

            // Include tool tip for the chart.
            viewer.ImageMap = c.getHTMLImageMap("clickable", "",
                "title='{dataSetName} on {xLabel|mmm yyyy}: {value} MJoule'");
        }
    }
}
[ASP.NET Web Forms - C# version] NetWebCharts\CSharpASP\xzonecolor.aspx
(Click here on how to convert this code to code-behind style.)<%@ Page Language="C#" Debug="true" %>
<%@ Import Namespace="ChartDirector" %>
<%@ Register TagPrefix="chart" Namespace="ChartDirector" Assembly="netchartdir" %>
<!DOCTYPE html>
<script runat="server">
//
// Page Load event handler
//
protected void Page_Load(object sender, EventArgs e)
{
// The data for the chart
double[] data = {50, 55, 47, 34, 42, 49, 63, 62, 73, 59, 56, 50, 64, 60, 67, 67, 58, 59, 73, 77,
84, 82, 80, 84, 89};
// The error data representing the error band around the data points
double[] errData = {5, 6, 5.1, 6.5, 6.6, 8, 5.4, 5.1, 4.6, 5.0, 5.2, 6.0, 4.9, 5.6, 4.8, 6.2,
7.4, 7.1, 6.5, 9.6, 12.1, 15.3, 18.5, 20.9, 24.1};
// The timestamps for the data
DateTime[] labels = {new DateTime(2001, 1, 1), new DateTime(2001, 2, 1), new DateTime(2001, 3, 1
), new DateTime(2001, 4, 1), new DateTime(2001, 5, 1), new DateTime(2001, 6, 1),
new DateTime(2001, 7, 1), new DateTime(2001, 8, 1), new DateTime(2001, 9, 1), new DateTime(
2001, 10, 1), new DateTime(2001, 11, 1), new DateTime(2001, 12, 1), new DateTime(2002, 1, 1
), new DateTime(2002, 2, 1), new DateTime(2002, 3, 1), new DateTime(2002, 4, 1),
new DateTime(2002, 5, 1), new DateTime(2002, 6, 1), new DateTime(2002, 7, 1), new DateTime(
2002, 8, 1), new DateTime(2002, 9, 1), new DateTime(2002, 10, 1), new DateTime(2002, 11, 1),
new DateTime(2002, 12, 1), new DateTime(2003, 1, 1)};
// Create a XYChart object of size 550 x 220 pixels
XYChart c = new XYChart(550, 220);
// Set the plot area at (50, 10) and of size 480 x 180 pixels. Enabled both vertical and
// horizontal grids by setting their colors to light grey (cccccc)
c.setPlotArea(50, 10, 480, 180).setGridColor(0xcccccc, 0xcccccc);
// Add a legend box (50, 10) (top of plot area) using horizontal layout. Use 8pt Arial font.
// Disable bounding box (set border to transparent).
LegendBox legendBox = c.addLegend(50, 10, false, "", 8);
legendBox.setBackground(Chart.Transparent);
// Add keys to the legend box to explain the color zones
legendBox.addKey("Historical", 0x9999ff);
legendBox.addKey("Forecast", 0xff9966);
// Add a title to the y axis.
c.yAxis().setTitle("Energy Consumption");
// Set the labels on the x axis
c.xAxis().setLabels2(labels);
// Set multi-style axis label formatting. Use Arial Bold font for yearly labels and display them
// as "yyyy". Use default font for monthly labels and display them as "mmm". Replace some labels
// with minor ticks to ensure the labels are at least 3 units apart.
c.xAxis().setMultiFormat(Chart.StartOfYearFilter(), "<*font=Arial Bold*>{value|yyyy}",
Chart.StartOfMonthFilter(), "{value|mmm}", 3);
// Add a line layer to the chart
LineLayer layer = c.addLineLayer2();
// Create the color to draw the data line. The line is blue (0x333399) to the left of x = 18,
// and become a red (0xd04040) dash line to the right of x = 18.
int lineColor = layer.xZoneColor(18, 0x333399, c.dashLineColor(0xd04040, Chart.DashLine));
// Add the data line
layer.addDataSet(data, lineColor, "Average");
// We are not showing the data set name in the legend box. The name is for showing in tool tips
// only.
layer.setLegend(Chart.NoLegend);
// Create the color to draw the err zone. The color is semi-transparent blue (0x809999ff) to the
// left of x = 18, and become semi-transparent red (0x80ff9966) to the right of x = 18.
int errColor = layer.xZoneColor(18, unchecked((int)0x809999ff), unchecked((int)0x80ff9966));
// Add the upper border of the err zone
layer.addDataSet(new ArrayMath(data).add(errData).result(), errColor, "Upper bound");
// Add the lower border of the err zone
layer.addDataSet(new ArrayMath(data).sub(errData).result(), errColor, "Lower bound");
// Set the default line width to 2 pixels
layer.setLineWidth(2);
// In this example, we are not showing the data set name in the legend box
layer.setLegend(Chart.NoLegend);
// Color the region between the err zone lines
c.addInterLineLayer(layer.getLine(1), layer.getLine(2), errColor);
// Output the chart
WebChartViewer1.Image = c.makeWebImage(Chart.SVG);
// Include tool tip for the chart.
WebChartViewer1.ImageMap = c.getHTMLImageMap("", "",
"title='{dataSetName} on {xLabel|mmm yyyy}: {value} MJoule'");
}
</script>
<html>
<head>
<script type="text/javascript" src="cdjcv.js"></script>
</head>
<body>
<chart:WebChartViewer id="WebChartViewer1" runat="server" />
</body>
</html>
[ASP.NET Web Forms - VB Version] NetWebCharts\VBNetASP\xzonecolor.aspx
(Click here on how to convert this code to code-behind style.)<%@ Page Language="VB" Debug="true" %>
<%@ Import Namespace="ChartDirector" %>
<%@ Register TagPrefix="chart" Namespace="ChartDirector" Assembly="netchartdir" %>
<!DOCTYPE html>
<script runat="server">
'
' Page Load event handler
'
Protected Sub Page_Load(ByVal sender As System.Object, ByVal e As System.EventArgs)
' The data for the chart
Dim data() As Double = {50, 55, 47, 34, 42, 49, 63, 62, 73, 59, 56, 50, 64, 60, 67, 67, 58, _
59, 73, 77, 84, 82, 80, 84, 89}
' The error data representing the error band around the data points
Dim errData() As Double = {5, 6, 5.1, 6.5, 6.6, 8, 5.4, 5.1, 4.6, 5.0, 5.2, 6.0, 4.9, 5.6, _
4.8, 6.2, 7.4, 7.1, 6.5, 9.6, 12.1, 15.3, 18.5, 20.9, 24.1}
' The timestamps for the data
Dim labels() As Date = {DateSerial(2001, 1, 1), DateSerial(2001, 2, 1), DateSerial(2001, 3, 1 _
), DateSerial(2001, 4, 1), DateSerial(2001, 5, 1), DateSerial(2001, 6, 1), DateSerial( _
2001, 7, 1), DateSerial(2001, 8, 1), DateSerial(2001, 9, 1), DateSerial(2001, 10, 1), _
DateSerial(2001, 11, 1), DateSerial(2001, 12, 1), DateSerial(2002, 1, 1), DateSerial(2002, _
2, 1), DateSerial(2002, 3, 1), DateSerial(2002, 4, 1), DateSerial(2002, 5, 1), DateSerial( _
2002, 6, 1), DateSerial(2002, 7, 1), DateSerial(2002, 8, 1), DateSerial(2002, 9, 1), _
DateSerial(2002, 10, 1), DateSerial(2002, 11, 1), DateSerial(2002, 12, 1), DateSerial( _
2003, 1, 1)}
' Create a XYChart object of size 550 x 220 pixels
Dim c As XYChart = New XYChart(550, 220)
' Set the plot area at (50, 10) and of size 480 x 180 pixels. Enabled both vertical and
' horizontal grids by setting their colors to light grey (cccccc)
c.setPlotArea(50, 10, 480, 180).setGridColor(&Hcccccc, &Hcccccc)
' Add a legend box (50, 10) (top of plot area) using horizontal layout. Use 8pt Arial font.
' Disable bounding box (set border to transparent).
Dim legendBox As LegendBox = c.addLegend(50, 10, False, "", 8)
legendBox.setBackground(Chart.Transparent)
' Add keys to the legend box to explain the color zones
legendBox.addKey("Historical", &H9999ff)
legendBox.addKey("Forecast", &Hff9966)
' Add a title to the y axis.
c.yAxis().setTitle("Energy Consumption")
' Set the labels on the x axis
c.xAxis().setLabels2(labels)
' Set multi-style axis label formatting. Use Arial Bold font for yearly labels and display them
' as "yyyy". Use default font for monthly labels and display them as "mmm". Replace some labels
' with minor ticks to ensure the labels are at least 3 units apart.
c.xAxis().setMultiFormat(Chart.StartOfYearFilter(), "<*font=Arial Bold*>{value|yyyy}", _
Chart.StartOfMonthFilter(), "{value|mmm}", 3)
' Add a line layer to the chart
Dim layer As LineLayer = c.addLineLayer2()
' Create the color to draw the data line. The line is blue (0x333399) to the left of x = 18, and
' become a red (0xd04040) dash line to the right of x = 18.
Dim lineColor As Integer = layer.xZoneColor(18, &H333399, c.dashLineColor(&Hd04040, _
Chart.DashLine))
' Add the data line
layer.addDataSet(data, lineColor, "Average")
' We are not showing the data set name in the legend box. The name is for showing in tool tips
' only.
layer.setLegend(Chart.NoLegend)
' Create the color to draw the err zone. The color is semi-transparent blue (0x809999ff) to the
' left of x = 18, and become semi-transparent red (0x80ff9966) to the right of x = 18.
Dim errColor As Integer = layer.xZoneColor(18, &H809999ff, &H80ff9966)
' Add the upper border of the err zone
layer.addDataSet(New ArrayMath(data).add(errData).result(), errColor, "Upper bound")
' Add the lower border of the err zone
layer.addDataSet(New ArrayMath(data).sub(errData).result(), errColor, "Lower bound")
' Set the default line width to 2 pixels
layer.setLineWidth(2)
' In this example, we are not showing the data set name in the legend box
layer.setLegend(Chart.NoLegend)
' Color the region between the err zone lines
c.addInterLineLayer(layer.getLine(1), layer.getLine(2), errColor)
' Output the chart
WebChartViewer1.Image = c.makeWebImage(Chart.SVG)
' Include tool tip for the chart.
WebChartViewer1.ImageMap = c.getHTMLImageMap("", "", _
"title='{dataSetName} on {xLabel|mmm yyyy}: {value} MJoule'")
End Sub
</script>
<html>
<head>
<script type="text/javascript" src="cdjcv.js"></script>
</head>
<body>
<chart:WebChartViewer id="WebChartViewer1" runat="server" />
</body>
</html>
[ASP.NET MVC - Controller] NetMvcCharts\Controllers\XzonecolorController.cs
using System;
using System.Web.Mvc;
using ChartDirector;

namespace NetMvcCharts.Controllers
{
    public class XzonecolorController : Controller
    {
        //
        // Default Action
        //
        public ActionResult Index()
        {
            ViewBag.Title = "X Zone Coloring";
            createChart(ViewBag.Viewer = new RazorChartViewer(HttpContext, "chart1"));
            return View("~/Views/Shared/ChartView.cshtml");
        }

        //
        // Create chart
        //
        private void createChart(RazorChartViewer viewer)
        {
            // The data for the chart
            double[] data = {50, 55, 47, 34, 42, 49, 63, 62, 73, 59, 56, 50, 64, 60, 67, 67, 58, 59, 73,
                77, 84, 82, 80, 84, 89};

            // The error data representing the error band around the data points
            double[] errData = {5, 6, 5.1, 6.5, 6.6, 8, 5.4, 5.1, 4.6, 5.0, 5.2, 6.0, 4.9, 5.6, 4.8, 6.2,
                7.4, 7.1, 6.5, 9.6, 12.1, 15.3, 18.5, 20.9, 24.1};

            // The timestamps for the data
            DateTime[] labels = {new DateTime(2001, 1, 1), new DateTime(2001, 2, 1), new DateTime(2001,
                3, 1), new DateTime(2001, 4, 1), new DateTime(2001, 5, 1), new DateTime(2001, 6, 1),
                new DateTime(2001, 7, 1), new DateTime(2001, 8, 1), new DateTime(2001, 9, 1),
                new DateTime(2001, 10, 1), new DateTime(2001, 11, 1), new DateTime(2001, 12, 1),
                new DateTime(2002, 1, 1), new DateTime(2002, 2, 1), new DateTime(2002, 3, 1),
                new DateTime(2002, 4, 1), new DateTime(2002, 5, 1), new DateTime(2002, 6, 1),
                new DateTime(2002, 7, 1), new DateTime(2002, 8, 1), new DateTime(2002, 9, 1),
                new DateTime(2002, 10, 1), new DateTime(2002, 11, 1), new DateTime(2002, 12, 1),
                new DateTime(2003, 1, 1)};

            // Create a XYChart object of size 550 x 220 pixels
            XYChart c = new XYChart(550, 220);

            // Set the plot area at (50, 10) and of size 480 x 180 pixels. Enabled both vertical and
            // horizontal grids by setting their colors to light grey (cccccc)
            c.setPlotArea(50, 10, 480, 180).setGridColor(0xcccccc, 0xcccccc);

            // Add a legend box (50, 10) (top of plot area) using horizontal layout. Use 8pt Arial font.
            // Disable bounding box (set border to transparent).
            LegendBox legendBox = c.addLegend(50, 10, false, "", 8);
            legendBox.setBackground(Chart.Transparent);

            // Add keys to the legend box to explain the color zones
            legendBox.addKey("Historical", 0x9999ff);
            legendBox.addKey("Forecast", 0xff9966);

            // Add a title to the y axis.
            c.yAxis().setTitle("Energy Consumption");

            // Set the labels on the x axis
            c.xAxis().setLabels2(labels);

            // Set multi-style axis label formatting. Use Arial Bold font for yearly labels and display
            // them as "yyyy". Use default font for monthly labels and display them as "mmm". Replace
            // some labels with minor ticks to ensure the labels are at least 3 units apart.
            c.xAxis().setMultiFormat(Chart.StartOfYearFilter(), "<*font=Arial Bold*>{value|yyyy}",
                Chart.StartOfMonthFilter(), "{value|mmm}", 3);

            // Add a line layer to the chart
            LineLayer layer = c.addLineLayer2();

            // Create the color to draw the data line. The line is blue (0x333399) to the left of x = 18,
            // and become a red (0xd04040) dash line to the right of x = 18.
            int lineColor = layer.xZoneColor(18, 0x333399, c.dashLineColor(0xd04040, Chart.DashLine));

            // Add the data line
            layer.addDataSet(data, lineColor, "Average");

            // We are not showing the data set name in the legend box. The name is for showing in tool
            // tips only.
            layer.setLegend(Chart.NoLegend);

            // Create the color to draw the err zone. The color is semi-transparent blue (0x809999ff) to
            // the left of x = 18, and become semi-transparent red (0x80ff9966) to the right of x = 18.
            int errColor = layer.xZoneColor(18, unchecked((int)0x809999ff), unchecked((int)0x80ff9966));

            // Add the upper border of the err zone
            layer.addDataSet(new ArrayMath(data).add(errData).result(), errColor, "Upper bound");

            // Add the lower border of the err zone
            layer.addDataSet(new ArrayMath(data).sub(errData).result(), errColor, "Lower bound");

            // Set the default line width to 2 pixels
            layer.setLineWidth(2);

            // In this example, we are not showing the data set name in the legend box
            layer.setLegend(Chart.NoLegend);

            // Color the region between the err zone lines
            c.addInterLineLayer(layer.getLine(1), layer.getLine(2), errColor);

            // Output the chart
            viewer.Image = c.makeWebImage(Chart.SVG);

            // Include tool tip for the chart.
            viewer.ImageMap = c.getHTMLImageMap("", "",
                "title='{dataSetName} on {xLabel|mmm yyyy}: {value} MJoule'");
        }
    }
}
[ASP.NET MVC - View] NetMvcCharts\Views\Shared\ChartView.cshtml
@{ Layout = null; }

<!DOCTYPE html>

<html>
<head>
    <meta name="viewport" content="width=device-width" />
    <title>@ViewBag.Title</title>
    <style>
        @ViewBag.Style
    </style>
    @Scripts.Render("~/Scripts/cdjcv.js")
</head>
<body style="margin:5px 0px 0px 5px">
    <div style="font:bold 18pt verdana;">
        @ViewBag.Title
    </div>
    <hr style="border:solid 1px #000080; background:#000080" />
    <div>
        @{
            if (ViewBag.Viewer is Array)
            {
                // Display multiple charts
                for (int i = 0; i < ViewBag.Viewer.Length; ++i)
                {
                    @:@Html.Raw(ViewBag.Viewer[i].RenderHTML())
                }
            }
            else
            {
                // Display one chart only
                @:@Html.Raw(ViewBag.Viewer.RenderHTML())
            }
        }
    </div>
</body>
</html>
© 2023 Advanced Software Engineering Limited. All rights reserved.