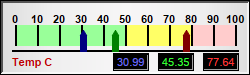
This example demonstrates a horizontal linear meter with multiple pointers.
ChartDirector 7.0 (Perl Edition)
Multi-Pointer Horizontal Meter
Source Code Listing
#!/usr/bin/perl

# The ChartDirector for Perl module is assumed to be in "../lib"
use File::Basename;
use lib (dirname($0)."/../lib") =~ /(.*)/;

use perlchartdir;

# The values to display on the meter
my $value0 = 30.99;
my $value1 = 45.35;
my $value2 = 77.64;

# Create an LinearMeter object of size 250 x 75 pixels, using silver background with a 2 pixel black
# 3D depressed border.
my $m = new LinearMeter(250, 75, perlchartdir::silverColor(), 0, -2);

# Set the scale region top-left corner at (15, 25), with size of 220 x 20 pixels. The scale labels
# are located on the top (implies horizontal meter)
$m->setMeter(15, 25, 220, 20, $perlchartdir::Top);

# Set meter scale from 0 - 100, with a tick every 10 units
$m->setScale(0, 100, 10);

# Set 0 - 50 as green (99ff99) zone, 50 - 80 as yellow (ffff66) zone, and 80 - 100 as red (ffcccc)
# zone
$m->addZone(0, 50, 0x99ff99);
$m->addZone(50, 80, 0xffff66);
$m->addZone(80, 100, 0xffcccc);

# Add deep red (000080), deep green (008000) and deep blue (800000) pointers to reflect the values
$m->addPointer($value0, 0x000080);
$m->addPointer($value1, 0x008000);
$m->addPointer($value2, 0x800000);

# Add a label at bottom-left (10, 68) using Arial Bold/8pt/red (c00000)
$m->addText(10, 68, "Temp C", "Arial Bold", 8, 0xc00000, $perlchartdir::BottomLeft);

# Add three text boxes to show the values in this meter
$m->addText(148, 70, $m->formatValue($value0, "2"), "Arial", 8, 0x6666ff, $perlchartdir::BottomRight
    )->setBackground(0, 0, -1);
$m->addText(193, 70, $m->formatValue($value1, "2"), "Arial", 8, 0x33ff33, $perlchartdir::BottomRight
    )->setBackground(0, 0, -1);
$m->addText(238, 70, $m->formatValue($value2, "2"), "Arial", 8, 0xff3333, $perlchartdir::BottomRight
    )->setBackground(0, 0, -1);

# Output the chart
$m->makeChart("multihmeter.png");