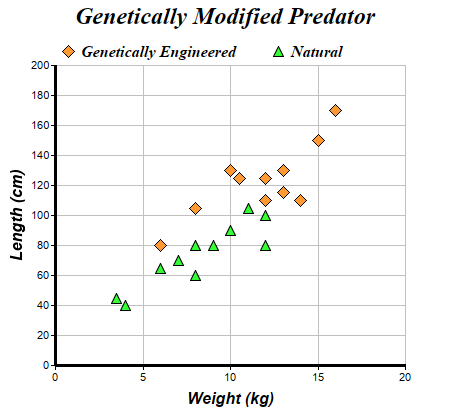
This example demonstrates a scatter chart created using XYChart.addScatterLayer.
ChartDirector 7.0 (Perl Edition)
Scatter Chart
Source Code Listing
#!/usr/bin/perl

# The ChartDirector for Perl module is assumed to be in "../lib"
use File::Basename;
use lib (dirname($0)."/../lib") =~ /(.*)/;

use perlchartdir;

# The XY points for the scatter chart
my $dataX0 = [10, 15, 6, 12, 14, 8, 13, 13, 16, 12, 10.5];
my $dataY0 = [130, 150, 80, 110, 110, 105, 130, 115, 170, 125, 125];

my $dataX1 = [6, 12, 4, 3.5, 7, 8, 9, 10, 12, 11, 8];
my $dataY1 = [65, 80, 40, 45, 70, 80, 80, 90, 100, 105, 60];

# Create a XYChart object of size 450 x 420 pixels
my $c = new XYChart(450, 420);

# Set the plotarea at (55, 65) and of size 350 x 300 pixels, with a light grey border (0xc0c0c0).
# Turn on both horizontal and vertical grid lines with light grey color (0xc0c0c0)
$c->setPlotArea(55, 65, 350, 300, -1, -1, 0xc0c0c0, 0xc0c0c0, -1);

# Add a legend box at (50, 30) (top of the chart) with horizontal layout. Use 12pt Times Bold Italic
# font. Set the background and border color to Transparent.
$c->addLegend(50, 30, 0, "Times New Roman Bold Italic", 12)->setBackground(
    $perlchartdir::Transparent);

# Add a title to the chart using 18pt Times Bold Itatic font.
$c->addTitle("Genetically Modified Predator", "Times New Roman Bold Italic", 18);

# Add a title to the y axis using 12pt Arial Bold Italic font
$c->yAxis()->setTitle("Length (cm)", "Arial Bold Italic", 12);

# Add a title to the x axis using 12pt Arial Bold Italic font
$c->xAxis()->setTitle("Weight (kg)", "Arial Bold Italic", 12);

# Set the axes line width to 3 pixels
$c->xAxis()->setWidth(3);
$c->yAxis()->setWidth(3);

# Add an orange (0xff9933) scatter chart layer, using 13 pixel diamonds as symbols
$c->addScatterLayer($dataX0, $dataY0, "Genetically Engineered", $perlchartdir::DiamondSymbol, 13,
    0xff9933);

# Add a green (0x33ff33) scatter chart layer, using 11 pixel triangles as symbols
$c->addScatterLayer($dataX1, $dataY1, "Natural", $perlchartdir::TriangleSymbol, 11, 0x33ff33);

# Output the chart
$c->makeChart("scatter.png");