This example demonstrates using external image files as scatter symbols.
The chart in this example is created as 5 scatter layers using
XYChart.addScatterLayer, with each layer containing one point.
The symbols for the scatter layers come from external image files. They are loaded using
DataSet.setDataSymbol2.
perldemo\scattersymbols.pl
#!/usr/bin/perl
# The ChartDirector for Perl module is assumed to be in "../lib"
use File::Basename;
use lib (dirname($0)."/../lib") =~ /(.*)/;
use perlchartdir;
# The XY points for the scatter chart
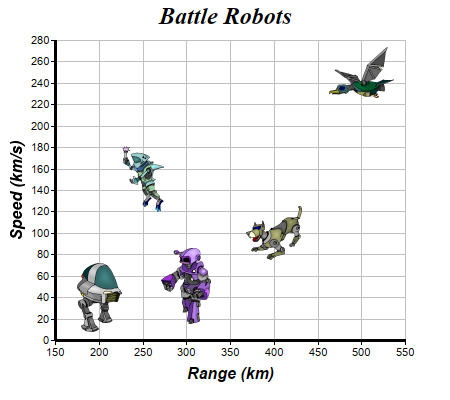
my $dataX = [200, 400, 300, 250, 500];
my $dataY = [40, 100, 50, 150, 250];
# The custom symbols for the points
my $symbols = ["robot1.png", "robot2.png", "robot3.png", "robot4.png", "robot5.png"];
# Create a XYChart object of size 450 x 400 pixels
my $c = new XYChart(450, 400);
# Set the plotarea at (55, 40) and of size 350 x 300 pixels, with a light grey border (0xc0c0c0).
# Turn on both horizontal and vertical grid lines with light grey color (0xc0c0c0)
$c->setPlotArea(55, 40, 350, 300, -1, -1, 0xc0c0c0, 0xc0c0c0, -1);
# Add a title to the chart using 18pt Times Bold Itatic font.
$c->addTitle("Battle Robots", "Times New Roman Bold Italic", 18);
# Add a title to the y axis using 12pt Arial Bold Italic font
$c->yAxis()->setTitle("Speed (km/s)", "Arial Bold Italic", 12);
# Add a title to the y axis using 12pt Arial Bold Italic font
$c->xAxis()->setTitle("Range (km)", "Arial Bold Italic", 12);
# Set the axes line width to 3 pixels
$c->xAxis()->setWidth(3);
$c->yAxis()->setWidth(3);
# Add each point of the data as a separate scatter layer, so that they can have a different symbol
for(my $i = 0; $i < scalar(@$dataX); ++$i) {
$c->addScatterLayer([$dataX->[$i]], [$dataY->[$i]])->getDataSet(0)->setDataSymbol2($symbols->[$i
]);
}
# Output the chart
$c->makeChart("scattersymbols.png");
© 2021 Advanced Software Engineering Limited. All rights reserved.