perldemo\stackedarea.pl
#!/usr/bin/perl
# The ChartDirector for Perl module is assumed to be in "../lib"
use File::Basename;
use lib (dirname($0)."/../lib") =~ /(.*)/;
use perlchartdir;
# The data for the area chart
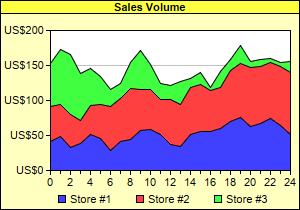
my $data0 = [42, 49, 33, 38, 51, 46, 29, 41, 44, 57, 59, 52, 37, 34, 51, 56, 56, 60, 70, 76, 63, 67,
75, 64, 51];
my $data1 = [50, 45, 47, 34, 42, 49, 63, 62, 73, 59, 56, 50, 64, 60, 67, 67, 58, 59, 73, 77, 84, 82,
80, 84, 89];
my $data2 = [61, 79, 85, 66, 53, 39, 24, 21, 37, 56, 37, 22, 21, 33, 13, 17, 4, 23, 16, 25, 9, 10,
5, 7, 16];
my $labels = ["0", "1", "2", "3", "4", "5", "6", "7", "8", "9", "10", "11", "12", "13", "14", "15",
"16", "17", "18", "19", "20", "21", "22", "23", "24"];
# Create a XYChart object of size 300 x 210 pixels. Set the background to pale yellow (0xffffc0)
# with a black border (0x0)
my $c = new XYChart(300, 210, 0xffffc0, 0x000000);
# Set the plotarea at (50, 30) and of size 240 x 140 pixels. Use white (0xffffff) background.
$c->setPlotArea(50, 30, 240, 140)->setBackground(0xffffff);
# Add a legend box at (50, 185) (below of plot area) using horizontal layout. Use 8pt Arial font
# with Transparent background.
$c->addLegend(50, 185, 0, "", 8)->setBackground($perlchartdir::Transparent);
# Add a title box to the chart using 8pt Arial Bold font, with yellow (0xffff40) background and a
# black border (0x0)
$c->addTitle("Sales Volume", "Arial Bold", 8)->setBackground(0xffff40, 0);
# Set the y axis label format to US$nnnn
$c->yAxis()->setLabelFormat("US\${value}");
# Set the labels on the x axis.
$c->xAxis()->setLabels($labels);
# Display 1 out of 2 labels on the x-axis. Show minor ticks for remaining labels.
$c->xAxis()->setLabelStep(2, 1);
# Add an stack area layer with three data sets
my $layer = $c->addAreaLayer2($perlchartdir::Stack);
$layer->addDataSet($data0, 0x4040ff, "Store #1");
$layer->addDataSet($data1, 0xff4040, "Store #2");
$layer->addDataSet($data2, 0x40ff40, "Store #3");
# Output the chart
$c->makeChart("stackedarea.png");
© 2021 Advanced Software Engineering Limited. All rights reserved.