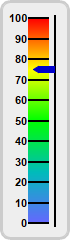
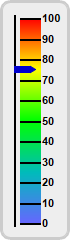
This example demonstration various orientations for vertical linear meters.
In a vertical linear meter, the scale labels can be positioned on the left or right side of the meter scale. This is controlled by the last argument to
LinearMeter.setMeter, which can be
Left or
Right.
perldemo\vlinearmeterorientation.pl
#!/usr/bin/perl

# The ChartDirector for Perl module is assumed to be in "../lib"
use File::Basename;
use lib (dirname($0)."/../lib") =~ /(.*)/;

use perlchartdir;

sub createChart
{
    my $chartIndex = shift;

    # The value to display on the meter
    my $value = 75.35;

    # Create a LinearMeter object of size 70 x 240 pixels with very light grey (0xeeeeee) backgruond
    # and a light grey (0xccccccc) 3-pixel thick rounded frame
    my $m = new LinearMeter(70, 240, 0xeeeeee, 0xcccccc);
    $m->setRoundedFrame($perlchartdir::Transparent);
    $m->setThickFrame(3);

    # This example demonstrates putting the text labels at the left or right side by setting the
    # label alignment and scale position.
    if ($chartIndex == 0) {
        $m->setMeter(28, 18, 20, 205, $perlchartdir::Left);
    } else {
        $m->setMeter(20, 18, 20, 205, $perlchartdir::Right);
    }

    # Set meter scale from 0 - 100, with a tick every 10 units
    $m->setScale(0, 100, 10);

    # Add a smooth color scale to the meter
    my $smoothColorScale = [0, 0x6666ff, 25, 0x00bbbb, 50, 0x00ff00, 75, 0xffff00, 100, 0xff0000];
    $m->addColorScale($smoothColorScale);

    # Add a blue (0x0000cc) pointer at the specified value
    $m->addPointer($value, 0x0000cc);

    # Output the chart
    $m->makeChart("vlinearmeterorientation$chartIndex.png");
}

createChart(0);
createChart(1);
© 2021 Advanced Software Engineering Limited. All rights reserved.