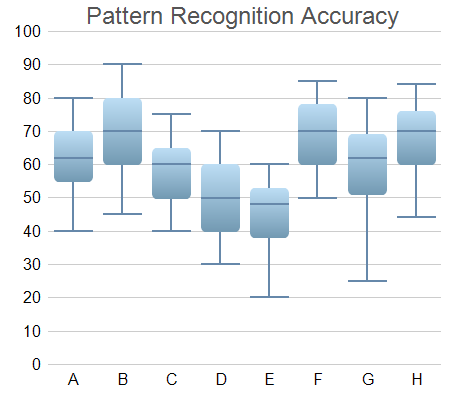
This example extends the Box-Whisker Chart (1) example to demonstrates various methods to control the chart appearance, including using different colors and font size, and using gradient shading and rounded corners for the boxes.
ChartDirector 7.0 (PHP Edition)
Box-Whisker Chart (2)
Source Code Listing
<?php
require_once("../lib/phpchartdir.php");

# Sample data for the Box-Whisker chart. Represents the minimum, 1st quartile, medium, 3rd quartile
# and maximum values of some quantities
$Q0Data = array(40, 45, 40, 30, 20, 50, 25, 44);
$Q1Data = array(55, 60, 50, 40, 38, 60, 51, 60);
$Q2Data = array(62, 70, 60, 50, 48, 70, 62, 70);
$Q3Data = array(70, 80, 65, 60, 53, 78, 69, 76);
$Q4Data = array(80, 90, 75, 70, 60, 85, 80, 84);

# The labels for the chart
$labels = array("A", "B", "C", "D", "E", "F", "G", "H");

# Create a XYChart object of size 450 x 400 pixels
$c = new XYChart(450, 400);

# Set the plotarea at (50, 30) and of size 380 x 340 pixels, with transparent background and border
# and light grey (0xcccccc) horizontal grid lines
$c->setPlotArea(50, 30, 380, 340, Transparent, -1, Transparent, 0xcccccc);

# Add a title box using grey (0x555555) 18pt Arial font
$title = $c->addTitle("     Pattern Recognition Accuracy", "Arial", 18, 0x555555);

# Set the x and y axis stems to transparent and the label font to 12pt Arial
$c->xAxis->setColors(Transparent);
$c->yAxis->setColors(Transparent);
$c->xAxis->setLabelStyle("Arial", 12);
$c->yAxis->setLabelStyle("Arial", 12);

# Set the labels on the x axis
$c->xAxis->setLabels($labels);

# For the automatic y-axis labels, set the minimum spacing to 30 pixels.
$c->yAxis->setTickDensity(30);

# Add a box whisker layer using light blue (0x99ccee) for the fill color and blue (0x6688aa) for the
# whisker color. Set line width to 2 pixels. Use rounded corners and bar lighting effect.
$b = $c->addBoxWhiskerLayer($Q3Data, $Q1Data, $Q4Data, $Q0Data, $Q2Data, 0x99ccee, 0x6688aa);
$b->setLineWidth(2);
$b->setRoundedCorners();
$b->setBorderColor(Transparent, barLighting());

# Adjust the plot area to fit under the title with 10-pixel margin on the other three sides.
$c->packPlotArea(10, $title->getHeight(), $c->getWidth() - 10, $c->getHeight() - 10);

# Output the chart
$viewer = new WebChartViewer("chart1");
$viewer->setChart($c, SVG);

# Include tool tip for the chart
$viewer->setImageMap($c->getHTMLImageMap("", "",
    "title='[{xLabel}] min/med/max = {min}/{med}/{max}\nInter-quartile range: {bottom} to {top}'"));
?>

<!DOCTYPE html>
<html>
<head>
    <title>Box-Whisker Chart (2)</title>
    <!-- Include ChartDirector Javascript Library to support chart interactions -->
    <script type="text/javascript" src="cdjcv.js"></script>
</head>
<body style="margin:5px 0px 0px 5px">
    <div style="font:bold 18pt verdana;">
        Box-Whisker Chart (2)
    </div>
    <hr style="border:solid 1px #000080; background:#000080" />
    <div style="font:10pt verdana; margin-bottom:1.5em">
        <a href="viewsource.php?file=<?=basename(__FILE__)?>">View Chart Source Code</a>
    </div>
    <!-- ****** Here is the chart image ****** -->
    <?php echo $viewer->renderHTML(); ?>
</body>
</html>