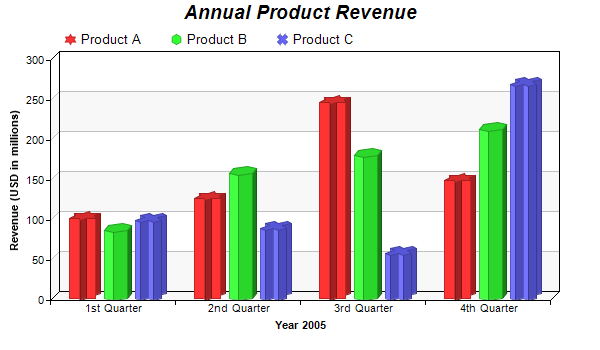
This example demonstrates a multi-bar chart in which each data set has a different bar shape.
The bar shapes are specified using BarLayer.setBarShape. See Shape Specification on how built-in and custom shapes are defined in ChartDirector.
ChartDirector 7.0 (PHP Edition)
Multi-Shape Bar Chart
Source Code Listing
<?php
require_once("../lib/phpchartdir.php");

# The data for the bar chart
$data0 = array(100, 125, 245, 147);
$data1 = array(85, 156, 179, 211);
$data2 = array(97, 87, 56, 267);
$labels = array("1st Quarter", "2nd Quarter", "3rd Quarter", "4th Quarter");

# Create a XYChart object of size 600 x 350 pixels
$c = new XYChart(600, 350);

# Add a title to the chart using 14pt Arial Bold Italic font
$c->addTitle("Annual Product Revenue", "Arial Bold Italic", 14);

# Set the plot area at (50, 60) and of size 500 x 240. Use two alternative background colors (f8f8f8
# and ffffff)
$c->setPlotArea(50, 60, 500, 240, 0xf8f8f8, 0xffffff);

# Add a legend box at (55, 22) using horizontal layout, with transparent background
$c->addLegend(55, 22, false)->setBackground(Transparent);

# Set the x axis labels
$c->xAxis->setLabels($labels);

# Draw the ticks between label positions (instead of at label positions)
$c->xAxis->setTickOffset(0.5);

# Add a multi-bar layer with 3 data sets and 9 pixels 3D depth
$layer = $c->addBarLayer2(Side, 9);
$layer->addDataSet($data0, -1, "Product A");
$layer->addDataSet($data1, -1, "Product B");
$layer->addDataSet($data2, -1, "Product C");

# Set data set 1 to use a bar shape of a 6-pointed star
$layer->setBarShape(StarShape(6), 0);

# Set data set 2 to use a bar shapre of a 6-sided polygon
$layer->setBarShape(PolygonShape(6), 1);

# Set data set 3 to use an X bar shape
$layer->setBarShape(Cross2Shape(), 2);

# Add a title to the y-axis
$c->yAxis->setTitle("Revenue (USD in millions)");

# Add a title to the x axis
$c->xAxis->setTitle("Year 2005");

# Output the chart
$viewer = new WebChartViewer("chart1");
$viewer->setChart($c, SVG);

# Include tool tip for the chart
$viewer->setImageMap($c->getHTMLImageMap("", "",
    "title='{dataSetName}: {xLabel} Revenue = {value} millions'"));
?>

<!DOCTYPE html>
<html>
<head>
    <title>Multi-Shape Bar Chart</title>
    <!-- Include ChartDirector Javascript Library to support chart interactions -->
    <script type="text/javascript" src="cdjcv.js"></script>
</head>
<body style="margin:5px 0px 0px 5px">
    <div style="font:bold 18pt verdana;">
        Multi-Shape Bar Chart
    </div>
    <hr style="border:solid 1px #000080; background:#000080" />
    <div style="font:10pt verdana; margin-bottom:1.5em">
        <a href="viewsource.php?file=<?=basename(__FILE__)?>">View Chart Source Code</a>
    </div>
    <!-- ****** Here is the chart image ****** -->
    <?php echo $viewer->renderHTML(); ?>
</body>
</html>