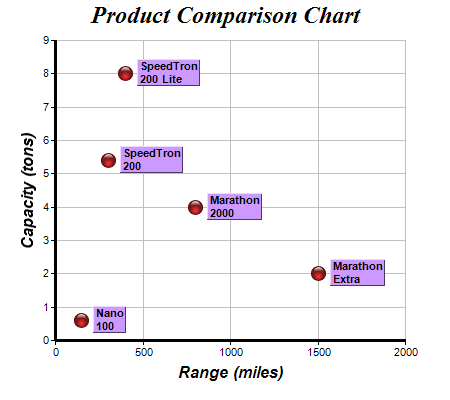
This example demonstrates adding custom labels to data points.
- The red glassy spheres in this example come from a scatter layer created using XYChart.addScatterLayer.
- The custom labels in this example is contained in an array variable, and is added as an extra field to the chart using Layer.addExtraField.
- The data label format is set using Layer.setDataLabelFormat to show the extra field.
- The font for the data labels is set to 8 points Arial Bold using Layer.setDataLabelStyle.
- Layer.setDataLabelStyle returns a TextBox object representing the prototype of the data labels. In this example, the TextBox object is used to customize the background colors, 3D borders, position offsets and alignments of the data labels.
[File: phpdemo/scatterlabels.php]
<?php
require_once("../lib/phpchartdir.php");

# The XY points for the scatter chart
$dataX = array(150, 400, 300, 1500, 800);
$dataY = array(0.6, 8, 5.4, 2, 4);

# The labels for the points
$labels = array("Nano\n100", "SpeedTron\n200 Lite", "SpeedTron\n200", "Marathon\nExtra",
    "Marathon\n2000");

# Create a XYChart object of size 450 x 400 pixels
$c = new XYChart(450, 400);

# Set the plotarea at (55, 40) and of size 350 x 300 pixels, with a light grey border (0xc0c0c0).
# Turn on both horizontal and vertical grid lines with light grey color (0xc0c0c0)
$c->setPlotArea(55, 40, 350, 300, 0xffffff, -1, 0xc0c0c0, 0xc0c0c0, -1);

# Add a title to the chart using 18pt Times Bold Itatic font.
$c->addTitle("Product Comparison Chart", "Times New Roman Bold Italic", 18);

# Add a title to the y axis using 12pt Arial Bold Italic font
$c->yAxis->setTitle("Capacity (tons)", "Arial Bold Italic", 12);

# Add a title to the x axis using 12pt Arial Bold Italic font
$c->xAxis->setTitle("Range (miles)", "Arial Bold Italic", 12);

# Set the axes line width to 3 pixels
$c->xAxis->setWidth(3);
$c->yAxis->setWidth(3);

# Add the data as a scatter chart layer, using a 15 pixel circle as the symbol
$layer = $c->addScatterLayer($dataX, $dataY, "", GlassSphereShape, 15, 0xff3333, 0xff3333);

# Add labels to the chart as an extra field
$layer->addExtraField($labels);

# Set the data label format to display the extra field
$layer->setDataLabelFormat("{field0}");

# Use 8pt Arial Bold to display the labels
$textbox = $layer->setDataLabelStyle("Arial Bold", 8);

# Set the background to purple with a 1 pixel 3D border
$textbox->setBackground(0xcc99ff, Transparent, 1);

# Put the text box 4 pixels to the right of the data point
$textbox->setAlignment(Left);
$textbox->setPos(4, 0);

# Output the chart
$viewer = new WebChartViewer("chart1");
$viewer->setChart($c, SVG);

# Include tool tip for the chart
$viewer->setImageMap($c->getHTMLImageMap("", "",
    "title='Range = {x} miles, Capacity = {value} tons'"));
?>

<!DOCTYPE html>
<html>
<head>
    <title>Custom Scatter Labels</title>
    <!-- Include ChartDirector Javascript Library to support chart interactions -->
    <script type="text/javascript" src="cdjcv.js"></script>
</head>
<body style="margin:5px 0px 0px 5px">
    <div style="font:bold 18pt verdana;">
        Custom Scatter Labels
    </div>
    <hr style="border:solid 1px #000080; background:#000080" />
    <div style="font:10pt verdana; margin-bottom:1.5em">
        <a href="viewsource.php?file=<?=basename(__FILE__)?>">View Chart Source Code</a>
    </div>
    <!-- ****** Here is the chart image ****** -->
    <?php echo $viewer->renderHTML(); ?>
</body>
</html>
© 2022 Advanced Software Engineering Limited. All rights reserved.