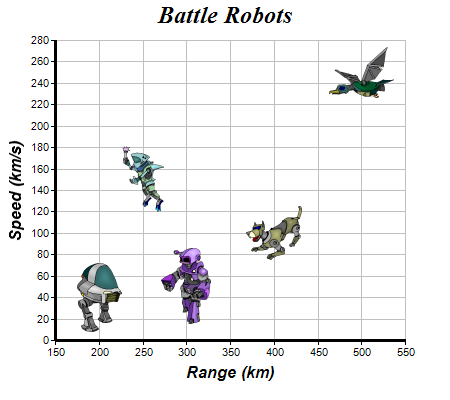
This example demonstrates using external image files as scatter symbols.
The chart in this example is created as 5 scatter layers using
XYChart.addScatterLayer, with each layer containing one point.
The symbols for the scatter layers come from external image files. They are loaded using
DataSet.setDataSymbol2.
[File: phpdemo/scattersymbols.php]
<?php
require_once("../lib/phpchartdir.php");

# The XY points for the scatter chart
$dataX = array(200, 400, 300, 250, 500);
$dataY = array(40, 100, 50, 150, 250);

# The custom symbols for the points
$symbols = array("robot1.png", "robot2.png", "robot3.png", "robot4.png", "robot5.png");

# Create a XYChart object of size 450 x 400 pixels
$c = new XYChart(450, 400);

# Set the plotarea at (55, 40) and of size 350 x 300 pixels, with a light grey border (0xc0c0c0).
# Turn on both horizontal and vertical grid lines with light grey color (0xc0c0c0)
$c->setPlotArea(55, 40, 350, 300, -1, -1, 0xc0c0c0, 0xc0c0c0, -1);

# Add a title to the chart using 18pt Times Bold Itatic font.
$c->addTitle("Battle Robots", "Times New Roman Bold Italic", 18);

# Add a title to the y axis using 12pt Arial Bold Italic font
$c->yAxis->setTitle("Speed (km/s)", "Arial Bold Italic", 12);

# Add a title to the y axis using 12pt Arial Bold Italic font
$c->xAxis->setTitle("Range (km)", "Arial Bold Italic", 12);

# Set the axes line width to 3 pixels
$c->xAxis->setWidth(3);
$c->yAxis->setWidth(3);

# Add each point of the data as a separate scatter layer, so that they can have a different symbol
for($i = 0; $i < count($dataX); ++$i) {
    $c->addScatterLayer(array($dataX[$i]), array($dataY[$i]))->getDataSet(0)->setDataSymbol2(
        dirname(__FILE__)."/".$symbols[$i]);
}

# Output the chart
$viewer = new WebChartViewer("chart1");
$viewer->setChart($c, SVG);

# Include tool tip for the chart
$viewer->setImageMap($c->getHTMLImageMap("", "", "title='Range = {x} km, Speed = {value} km/s'"));
?>

<!DOCTYPE html>
<html>
<head>
    <title>Custom Scatter Symbols</title>
    <!-- Include ChartDirector Javascript Library to support chart interactions -->
    <script type="text/javascript" src="cdjcv.js"></script>
</head>
<body style="margin:5px 0px 0px 5px">
    <div style="font:bold 18pt verdana;">
        Custom Scatter Symbols
    </div>
    <hr style="border:solid 1px #000080; background:#000080" />
    <div style="font:10pt verdana; margin-bottom:1.5em">
        <a href="viewsource.php?file=<?=basename(__FILE__)?>">View Chart Source Code</a>
    </div>
    <!-- ****** Here is the chart image ****** -->
    <?php echo $viewer->renderHTML(); ?>
</body>
</html>
© 2022 Advanced Software Engineering Limited. All rights reserved.