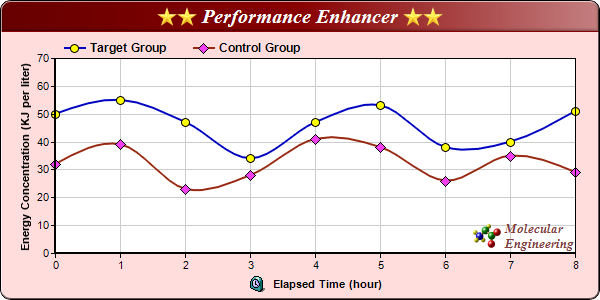
This example demonstrates using spline curves to join data points, title with soft lighting effect, as well as a number of chart formatting techniques.
- Add a spline layer to the chart using XYChart.addSplineLayer.
- Set the shapes, sizes and colors of the data symbols using DataSet.setDataSymbol.
- The soft lighting effect of the title is defined using softLighting, then applied to the title using Box.setBackground of the title TextBox object.
- Set the background, border and grid colors of the plot area using XYChart.setPlotArea.
- Control the line width of the axes using Axis.setWidth.
- Include icon images in chart and axis titles using CDML.
- Add a logo at the bottom right corner of the plot area as custom text using BaseChart.addText with BottomRight alignment. The logo includes images and text encoded using CDML.
- For web applications, we need to set the search path to load the icon images from the current script directory using BaseChart.setSearchPath. It is because for some web servers (eg. IIS), the default current directory is not the script directory (eg. IIS uses the IIS executable directory), so the search path needs to be set explicitly.
[File: phpdemo/splineline.php]
<?php
require_once("../lib/phpchartdir.php");

# The data for the chart
$data0 = array(32, 39, 23, 28, 41, 38, 26, 35, 29);
$data1 = array(50, 55, 47, 34, 47, 53, 38, 40, 51);

# The labels for the chart
$labels = array("0", "1", "2", "3", "4", "5", "6", "7", "8");

# Create a XYChart object of size 600 x 300 pixels, with a pale red (ffdddd) background, black
# border, 1 pixel 3D border effect and rounded corners.
$c = new XYChart(600, 300, 0xffdddd, 0x000000, 1);
$c->setRoundedFrame();

# Set directory for loading images to current script directory
# Need when running under Microsoft IIS
$c->setSearchPath(dirname(__FILE__));

# Set the plotarea at (55, 58) and of size 520 x 195 pixels, with white (ffffff) background. Set
# horizontal and vertical grid lines to grey (cccccc).
$c->setPlotArea(55, 58, 520, 195, 0xffffff, -1, -1, 0xcccccc, 0xcccccc);

# Add a legend box at (55, 32) (top of the chart) with horizontal layout. Use 9pt Arial Bold font.
# Set the background and border color to Transparent.
$c->addLegend(55, 32, false, "Arial Bold", 9)->setBackground(Transparent);

# Add a title box to the chart using 15pt Times Bold Italic font. The title is in CDML and includes
# embedded images for highlight. The text is white (ffffff) on a dark red (880000) background, with
# soft lighting effect from the right side.
$c->addTitle(
    "<*block,valign=absmiddle*><*img=star.png*><*img=star.png*> Performance Enhancer ".
    "<*img=star.png*><*img=star.png*><*/*>", "Times New Roman Bold Italic", 15, 0xffffff
    )->setBackground(0x880000, -1, softLighting(Right));

# Add a title to the y axis
$c->yAxis->setTitle("Energy Concentration (KJ per liter)");

# Set the labels on the x axis
$c->xAxis->setLabels($labels);

# Add a title to the x axis using CMDL
$c->xAxis->setTitle("<*block,valign=absmiddle*><*img=clock.png*>  Elapsed Time (hour)<*/*>");

# Set the axes width to 2 pixels
$c->xAxis->setWidth(2);
$c->yAxis->setWidth(2);

# Add a spline layer to the chart
$layer = $c->addSplineLayer();

# Set the default line width to 2 pixels
$layer->setLineWidth(2);

# Add a data set to the spline layer, using blue (0000c0) as the line color, with yellow (ffff00)
# circle symbols.
$layer->addDataSet($data1, 0x0000c0, "Target Group")->setDataSymbol(CircleSymbol, 9, 0xffff00);

# Add a data set to the spline layer, using brown (982810) as the line color, with pink (f040f0)
# diamond symbols.
$layer->addDataSet($data0, 0x982810, "Control Group")->setDataSymbol(DiamondSymbol, 11, 0xf040f0);

# Add a custom CDML text at the bottom right of the plot area as the logo
$c->addText(575, 250,
    "<*block,valign=absmiddle*><*img=small_molecule.png*> <*block*><*font=Times New Roman Bold ".
    "Italic,size=10,color=804040*>Molecular\nEngineering<*/*>")->setAlignment(BottomRight);

# Output the chart
$viewer = new WebChartViewer("chart1");
$viewer->setChart($c, SVG);

# Include tool tip for the chart
$viewer->setImageMap($c->getHTMLImageMap("", "",
    "title='{dataSetName} at t = {xLabel} hour: {value} KJ/liter'"));
?>

<!DOCTYPE html>
<html>
<head>
    <title>Spline Line Chart</title>
    <!-- Include ChartDirector Javascript Library to support chart interactions -->
    <script type="text/javascript" src="cdjcv.js"></script>
</head>
<body style="margin:5px 0px 0px 5px">
    <div style="font:bold 18pt verdana;">
        Spline Line Chart
    </div>
    <hr style="border:solid 1px #000080; background:#000080" />
    <div style="font:10pt verdana; margin-bottom:1.5em">
        <a href="viewsource.php?file=<?=basename(__FILE__)?>">View Chart Source Code</a>
    </div>
    <!-- ****** Here is the chart image ****** -->
    <?php echo $viewer->renderHTML(); ?>
</body>
</html>
© 2022 Advanced Software Engineering Limited. All rights reserved.