[File: phpdemo/surface4d.php]
<?php
require_once("../lib/phpchartdir.php");
function createChart($viewer, $chartIndex)
{
# The x and y coordinates of the grid
$dataX = array(-10, -9, -8, -7, -6, -5, -4, -3, -2, -1, 0, 1, 2, 3, 4, 5, 6, 7, 8, 9, 10);
$dataY = array(-10, -9, -8, -7, -6, -5, -4, -3, -2, -1, 0, 1, 2, 3, 4, 5, 6, 7, 8, 9, 10);
# The values at the grid points. In this example, we will compute the values using the formula z
# = x * sin(y) + y * sin(x).
$dataZ = array_fill(0, count($dataX) * count($dataY), 0);
for($yIndex = 0; $yIndex < count($dataY); ++$yIndex) {
$y = $dataY[$yIndex];
for($xIndex = 0; $xIndex < count($dataX); ++$xIndex) {
$x = $dataX[$xIndex];
$dataZ[$yIndex * count($dataX) + $xIndex] = $x * sin($y) + $y * sin($x);
}
}
# Create a SurfaceChart object of size 460 x 460 pixels, with white (ffffff) background and grey
# (888888) border.
$c = new SurfaceChart(460, 460, 0xffffff, 0x888888);
# Add a color axis at the top center of the chart, with labels at the bottom side
$cAxis = $c->setColorAxis($c->getWidth() / 2, 10, Top, 250, Bottom);
# If the color is based on the z-values, the color axis will synchronize with the z-axis. (The
# Axis.syncAxis can be used to disable that.) Otherwise, the color axis will auto-scale
# independently. In the latter case, we set the tick spacing to at least 20 pixels.
$cAxis->setTickDensity(20);
# Set flat color axis style
$cAxis->setAxisBorder(Transparent, 0);
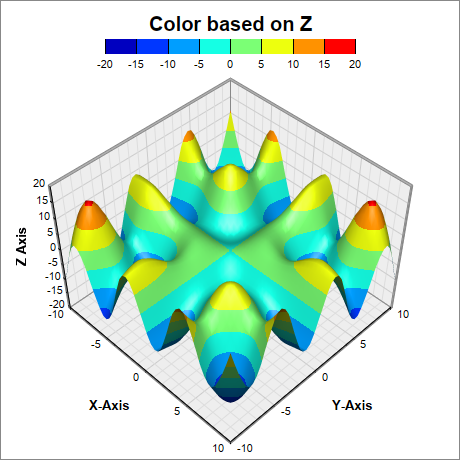
if ($chartIndex == 0) {
# The default is to use the Z values to determine the color.
$cAxis->setTitle("Color based on Z", "Arial Bold", 15);
$c->setData($dataX, $dataY, $dataZ);
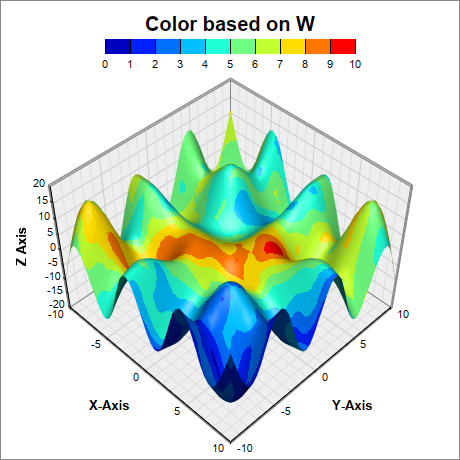
} else if ($chartIndex == 1) {
# ChartDirector supports using an extra value (called W value) to determine the color.
$cAxis->setTitle("Color based on W", "Arial Bold", 15);
# Use random W values
$r = new RanSeries(5);
$dataW = $r->get2DSeries(count($dataX), count($dataY), 0.5, 9.5);
$c->setData($dataX, $dataY, $dataZ, $dataW);
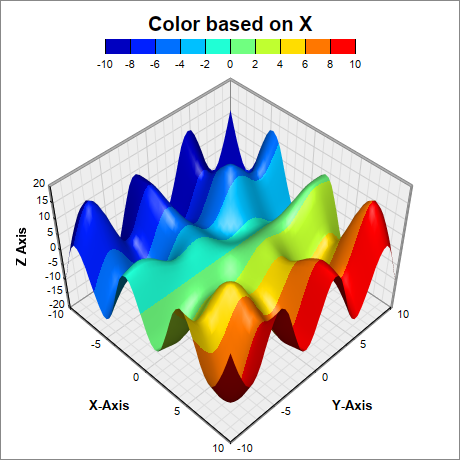
} else if ($chartIndex == 2) {
# We can set the W values to the X coordinates. The color will then be determined by the X
# coordinates.
$cAxis->setTitle("Color based on X", "Arial Bold", 15);
$colorX = array_fill(0, count($dataZ), 0);
for($yIndex = 0; $yIndex < count($dataY); ++$yIndex) {
for($xIndex = 0; $xIndex < count($dataX); ++$xIndex) {
$colorX[$yIndex * count($dataX) + $xIndex] = $dataX[$xIndex];
}
}
$c->setData($dataX, $dataY, $dataZ, $colorX);
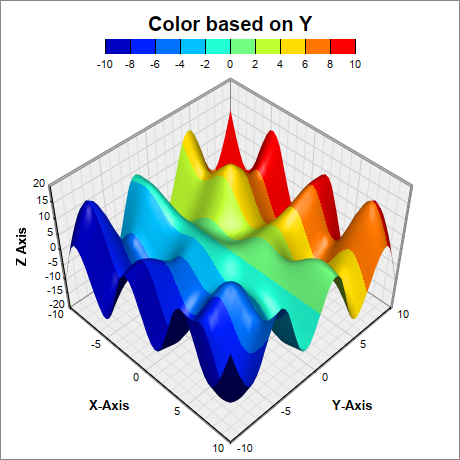
} else {
# We can set the W values to the Y coordinates. The color will then be determined by the Y
# coordinates.
$cAxis->setTitle("Color based on Y", "Arial Bold", 15);
$colorY = array_fill(0, count($dataZ), 0);
for($yIndex = 0; $yIndex < count($dataY); ++$yIndex) {
for($xIndex = 0; $xIndex < count($dataX); ++$xIndex) {
$colorY[$yIndex * count($dataX) + $xIndex] = $dataY[$yIndex];
}
}
$c->setData($dataX, $dataY, $dataZ, $colorY);
}
# Set the center of the plot region at (230, 250), and set width x depth x height to 240 x 240 x
# 170 pixels
$c->setPlotRegion(230, 250, 240, 240, 170);
# Set the plot region wall thichness to 3 pixels
$c->setWallThickness(3);
# Set the elevation and rotation angles to 45 degrees
$c->setViewAngle(45, 45);
# Set the perspective level to 20
$c->setPerspective(20);
# Spline interpolate data to a 50 x 50 grid for a smooth surface
$c->setInterpolation(50, 50);
# Add the axis titles
$c->xAxis->setTitle("X-Axis", "Arial Bold", 10);
$c->yAxis->setTitle("Y-Axis", "Arial Bold", 10);
$c->zAxis->setTitle("Z Axis", "Arial Bold", 10);
# Output the chart
$viewer->setChart($c, SVG);
}
# This example includes 4 charts
$viewers = array();
for ($i = 0; $i < 4; ++$i) {
$viewers[$i] = new WebChartViewer("chart$i");
createChart($viewers[$i], $i);
}
?>
<!DOCTYPE html>
<html>
<head>
<title>4D Surface Chart</title>
<!-- Include ChartDirector Javascript Library to support chart interactions -->
<script type="text/javascript" src="cdjcv.js"></script>
</head>
<body style="margin:5px 0px 0px 5px">
<div style="font:bold 18pt verdana;">
4D Surface Chart
</div>
<hr style="border:solid 1px #000080; background:#000080" />
<div style="font:10pt verdana; margin-bottom:1.5em">
<a href="viewsource.php?file=<?=basename(__FILE__)?>">View Chart Source Code</a>
</div>
<!-- ****** Here are the chart images ****** -->
<?php
for ($i = 0; $i < count($viewers); ++$i) {
echo $viewers[$i]->renderHTML(), " ";
}
?>
</body>
</html>
© 2022 Advanced Software Engineering Limited. All rights reserved.