[File: phpdemo/surfacetexture.php]
<?php
require_once("../lib/phpchartdir.php");
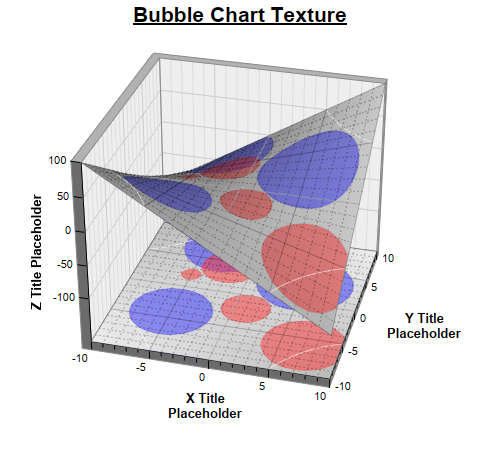
# Use a bubble chart as the surface texture
function addBubbleTexture($sc) {
# Set the original surface color to be from grey (0xbbbbbb) to light grey (0xeeeeee) based on
# the z-value. This will become the background color of the surface.
$sc->colorAxis->setColorGradient(true, array(0xbbbbbb, 0xeeeeee));
# The data values for the red bubbles
$dataX0 = array(-5, -2, 1, 7);
$dataY0 = array(2, 4, -2, -6);
$dataZ0 = array(20, 60, 50, 85);
# The data values for the blue bubbles
$dataX1 = array(5, -5, -3);
$dataY1 = array(3, -4, 7);
$dataZ1 = array(100, 85, 95);
# Create a bubble chart of the same size as the surface XY size
$c = new XYChart($sc->getPlotRegionWidth(), $sc->getPlotRegionDepth(), Transparent);
$c->setPlotArea(0, 0, $c->getWidth(), $c->getHeight(), -1, -1, Transparent, Transparent);
# Synchronize the bubble chart axis scale to the surface axis scale. As the surface axes are
# visible, we can hide the bubble chart axes.
$c->yAxis->syncAxis($sc->yAxis);
$c->xAxis->syncAxis($sc->xAxis);
$c->xAxis->setColors(Transparent);
$c->yAxis->setColors(Transparent);
# Add bubbles with the semi-transparent red color (0x7fff3333). Also add a matching legend entry
# to the surface chart.
$c->addScatterLayer($dataX0, $dataY0, "", CircleSymbol, 9, 0x7fff3333, 0x7fff3333
)->setSymbolScale($dataZ0);
$sc->getLegend()->addKey("Hot Zone", 0x7fff3333);
# Add bubbles with the semi-transparent blue color (0x7f3333ff). Also add a matchine legend
# entry to the surface chart
$c->addScatterLayer($dataX1, $dataY1, "", CircleSymbol, 9, 0x7f3333ff, 0x7f3333ff
)->setSymbolScale($dataZ1);
$sc->getLegend()->addKey("Wet Zone", 0x7f3333ff);
# Before we generate the bubble chart as texture, we must layout the surface chart first. It is
# because the bubble chart axis scale depends on the surface chart axis scale.
$sc->layout();
# Output the bubble chart and save it as a resource
$sc->setResource("texture", $c->makeChart3());
# Use the resource as the texture
$sc->setSurfaceTexture($sc->patternColor("@/texture"));
}
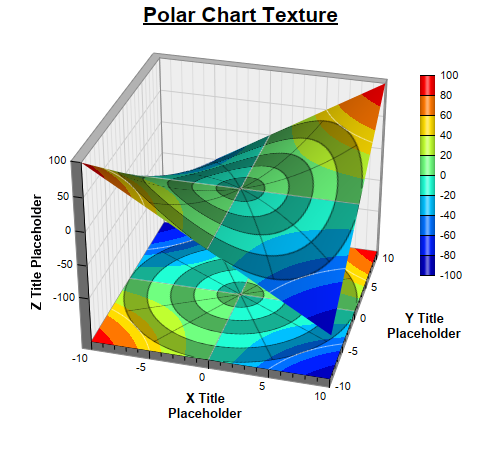
# Use a polar chart as the surface texture
function addPolarTexture($sc) {
$sc->setSurfaceAxisGrid(Transparent, Transparent);
$c = new PolarChart($sc->getPlotRegionWidth(), $sc->getPlotRegionDepth(), Transparent);
$c->setPlotArea((int)($c->getWidth() / 2), (int)($c->getHeight() / 2), (int)($c->getWidth() / 2)
);
# Use alternative light grey/dark grey circular background color
$c->setPlotAreaBg(0xaf000000, Transparent);
# Set the grid style to circular grid
$c->setGridStyle(false);
# Set angular axis as 0 - 360, with a spoke every 30 units
$c->angularAxis->setLinearScale(0, 360, 30);
$c->angularAxis->setLabelStyle("normal", 8, Transparent);
$c->radialAxis->setLinearScale(0, 10, 2);
$c->radialAxis->setColors(Transparent, Transparent);
# Output the polar chart and save it as a resource
$sc->setResource("texture", $c->makeChart3());
# Use the resource as the texture
$sc->setSurfaceTexture($sc->patternColor("@/texture"));
}
function createChart($viewer, $chartIndex)
{
# The x and y coordinates of the grid
$dataX = array(-10, -9, -8, -7, -6, -5, -4, -3, -2, -1, 0, 1, 2, 3, 4, 5, 6, 7, 8, 9, 10);
$dataY = array(-10, -9, -8, -7, -6, -5, -4, -3, -2, -1, 0, 1, 2, 3, 4, 5, 6, 7, 8, 9, 10);
# The values at the grid points. In this example, we will compute the values using the formula z
# = x * y.
$dataZ = array_fill(0, count($dataX) * count($dataY), 0);
for($yIndex = 0; $yIndex < count($dataY); ++$yIndex) {
for($xIndex = 0; $xIndex < count($dataX); ++$xIndex) {
$dataZ[$yIndex * count($dataX) + $xIndex] = $dataX[$xIndex] * $dataY[$yIndex];
}
}
# Create a SurfaceChart object of size 480 x 450 pixels
$c = new SurfaceChart(480, 450);
# Set the center of the plot region at (240, 210), and set width x depth x height to 240 x 240 x
# 200 pixels
$c->setPlotRegion(240, 210, 240, 240, 200);
# Set the elevation and rotation angles to 30 and 15 degrees
$c->setViewAngle(30, 15);
# Set the data to use to plot the chart
$c->setData($dataX, $dataY, $dataZ);
# Spline interpolate data to a 80 x 80 grid for a smooth surface
$c->setInterpolation(80, 80);
# Reserve 50 pixels at the bottom of the z-axis to allow for the XY projection
$c->zAxis->setMargin(0, 50);
# Add XY projection
$c->addXYProjection();
# Use semi-transparent black (0xc0000000) for x and y major surface grid lines. Use dotted style
# for x and y minor surface grid lines.
$majorGridColor = 0xc0000000;
$minorGridColor = $c->dashLineColor($majorGridColor, DotLine);
$c->setSurfaceAxisGrid($majorGridColor, $majorGridColor, $minorGridColor, $minorGridColor);
# Get the surface texture
if ($chartIndex == 0) {
# Surface texture is a bubble chart
$c->addTitle("<*underline=2*>Bubble Chart Texture", "Arial Bold", 16);
# This texture uses the legend box, so we need to add a legend box to the chart at (490,
# 200).
$b = $c->addLegend(490, 200, true, "Arial Bold", 10);
$b->setBackground(Transparent, Transparent);
$b->setMaxWidth($c->getWidth() - 490 - 1);
# Add the texture
addBubbleTexture($c);
} else if ($chartIndex == 1) {
# Surface Texture is a polar chart
$c->addTitle("<*underline=2*>Polar Chart Texture", "Arial Bold", 16);
# This texture uses the color axis, so we add the color axis at (420, 75)
$cAxis = $c->setColorAxis(420, 75, TopLeft, 200, Right);
# By default, the color axis synchronizes with the z-axis. We cancel the synchronization so
# that the color axis will auto-scale independently.
$cAxis->syncAxis(null);
# Add the texture
addPolarTexture($c);
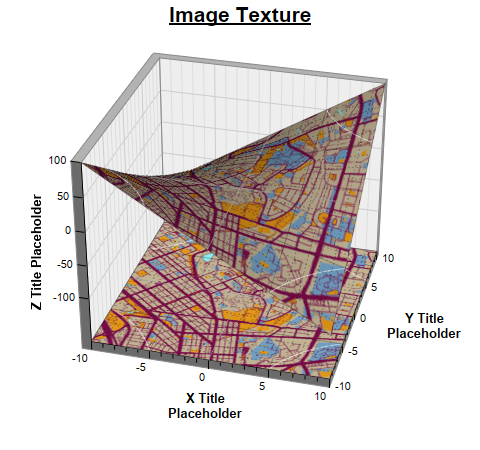
} else {
# Surface Texture is an image
$c->addTitle("<*underline=2*>Image Texture", "Arial Bold", 16);
# Use a DrawArea to load the image
$d = new DrawArea();
# Set directory for loading images to current script directory
# Need when running under Microsoft IIS
$d->setSearchPath(dirname(__FILE__));
# Load image and resize it to fit the plot region
$d->load("maptexture.png");
$d->resize($c->getPlotRegionWidth(), $c->getPlotRegionDepth());
# Set the DrawArea as a resource
$c->setResource("texture", $d);
# Use the resource as the texture
$c->setSurfaceTexture($c->patternColor("@/texture"));
}
# Set contour lines to semi-transparent white (7fffffff)
$c->setContourColor(0x7fffffff);
# Set the x, y and z axis titles using 10 pt Arial Bold font
$c->xAxis->setTitle("X Title<*br*>Placeholder", "Arial Bold", 10);
$c->yAxis->setTitle("Y Title<*br*>Placeholder", "Arial Bold", 10);
$c->zAxis->setTitle("Z Title Placeholder", "Arial Bold", 10);
# Output the chart
$viewer->setChart($c, SVG);
}
# This example includes 3 charts
$viewers = array();
for ($i = 0; $i < 3; ++$i) {
$viewers[$i] = new WebChartViewer("chart$i");
createChart($viewers[$i], $i);
}
?>
<!DOCTYPE html>
<html>
<head>
<title>Surface Texture</title>
<!-- Include ChartDirector Javascript Library to support chart interactions -->
<script type="text/javascript" src="cdjcv.js"></script>
</head>
<body style="margin:5px 0px 0px 5px">
<div style="font:bold 18pt verdana;">
Surface Texture
</div>
<hr style="border:solid 1px #000080; background:#000080" />
<div style="font:10pt verdana; margin-bottom:1.5em">
<a href="viewsource.php?file=<?=basename(__FILE__)?>">View Chart Source Code</a>
</div>
<!-- ****** Here are the chart images ****** -->
<?php
for ($i = 0; $i < count($viewers); ++$i) {
echo $viewers[$i]->renderHTML(), " ";
}
?>
</body>
</html>
© 2022 Advanced Software Engineering Limited. All rights reserved.