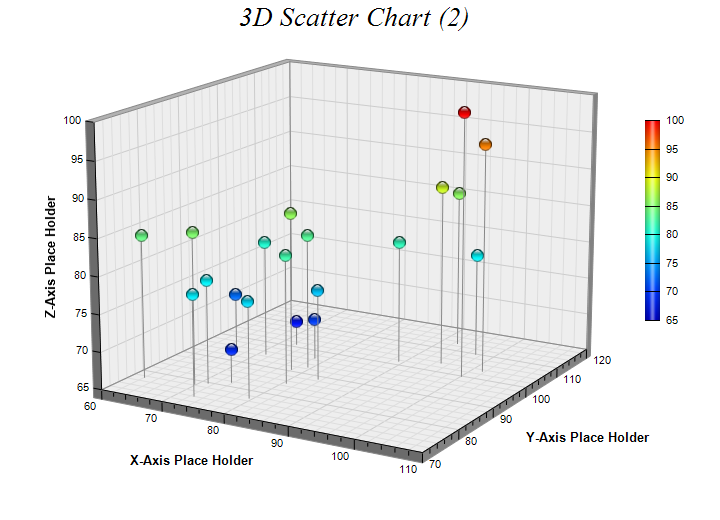
This example extends the
3D Scatter Chart (1) example by including drop lines, using alternative view angles and continuous coloring.
Drop lines are lines that drop from the data points to the XY plane. They help to visualize the "height" (the z-coordinate) of the points and can be useful if there are not too many data points.
[File: phpdemo/threedscatter2.php]
<?php
require_once("../lib/phpchartdir.php");

# The XYZ data for the 3D scatter chart as 3 random data series
$r = new RanSeries(3);
$xData = $r->getSeries2(20, 100, -10, 10);
$yData = $r->getSeries2(20, 100, -10, 10);
$zData = $r->getSeries2(20, 100, -10, 10);

# Create a ThreeDScatterChart object of size 720 x 520 pixels
$c = new ThreeDScatterChart(720, 520);

# Add a title to the chart using 20 points Times New Roman Italic font
$c->addTitle("3D Scatter Chart (2)  ", "Times New Roman Italic", 20);

# Set the center of the plot region at (350, 240), and set width x depth x height to 360 x 360 x 270
# pixels
$c->setPlotRegion(350, 240, 360, 360, 270);

# Set the elevation and rotation angles to 15 and 30 degrees
$c->setViewAngle(15, 30);

# Add a scatter group to the chart using 13 pixels glass sphere symbols, in which the color depends
# on the z value of the symbol
$g = $c->addScatterGroup($xData, $yData, $zData, "", GlassSphere2Shape, 13, SameAsMainColor);

# Add grey (888888) drop lines to the symbols
$g->setDropLine(0x888888);

# Add a color axis (the legend) in which the left center is anchored at (645, 220). Set the length
# to 200 pixels and the labels on the right side. Use smooth gradient coloring.
$c->setColorAxis(645, 220, Left, 200, Right)->setColorGradient();

# Set the x, y and z axis titles using 10 points Arial Bold font
$c->xAxis->setTitle("X-Axis Place Holder", "Arial Bold", 10);
$c->yAxis->setTitle("Y-Axis Place Holder", "Arial Bold", 10);
$c->zAxis->setTitle("Z-Axis Place Holder", "Arial Bold", 10);

# Output the chart
$viewer = new WebChartViewer("chart1");
$viewer->setChart($c, SVG);

# Include tool tip for the chart
$viewer->setImageMap($c->getHTMLImageMap("", "", "title='<*cdml*>x={x|p}, y={y|p}, z={z|p}'"));
?>

<!DOCTYPE html>
<html>
<head>
    <title>3D Scatter Chart (2)</title>
    <!-- Include ChartDirector Javascript Library to support chart interactions -->
    <script type="text/javascript" src="cdjcv.js"></script>
</head>
<body style="margin:5px 0px 0px 5px">
    <div style="font:bold 18pt verdana;">
        3D Scatter Chart (2)
    </div>
    <hr style="border:solid 1px #000080; background:#000080" />
    <div style="font:10pt verdana; margin-bottom:1.5em">
        <a href="viewsource.php?file=<?=basename(__FILE__)?>">View Chart Source Code</a>
    </div>
    <!-- ****** Here is the chart image ****** -->
    <?php echo $viewer->renderHTML(); ?>
</body>
</html>
© 2022 Advanced Software Engineering Limited. All rights reserved.