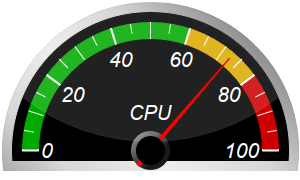
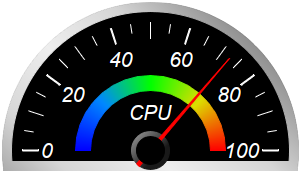
This example demonstrates semicircle meters with black background, silver border and glare effect.
The silver border effect is achieved by using
AngularMeter.relativeLinearGradient to create a gradient consisting of varying levels of grey.
Glare effect is added to some of the meters using
AngularMeter.addGlare. Glare effect works best in a dark background.
pythondemo\blacksemicirclemeter.py
#!/usr/bin/python
# The ChartDirector for Python module is assumed to be in "../lib"
import sys, os
sys.path.insert(0, os.path.join(os.path.abspath(sys.path[0]), "..", "lib"))
from pychartdir import *
def createChart(chartIndex) :
# The value to display on the meter
value = 72.55
# Create an AngularMeter object of size 300 x 180 pixels with transparent background
m = AngularMeter(300, 180, Transparent)
# Set the default text and line colors to white (0xffffff)
m.setColor(TextColor, 0xffffff)
m.setColor(LineColor, 0xffffff)
# Center at (150, 150), scale radius = 128 pixels, scale angle -90 to +90 degrees
m.setMeter(150, 150, 128, -90, 90)
# Gradient color for the border to make it silver-like
ringGradient = [1, 0x909090, 0.5, 0xd6d6d6, 0, 0xeeeeee, -0.5, 0xd6d6d6, -1, 0x909090]
# Add a black (0x000000) scale background of 148 pixels radius with a 10 pixel thick silver
# border
m.addScaleBackground(148, 0, 10, m.relativeLinearGradient(ringGradient, 45, 148))
# Meter scale is 0 - 100, with major tick every 20 units, minor tick every 10 units, and micro
# tick every 5 units
m.setScale(0, 100, 20, 10, 5)
# Set the scale label style to 15pt Arial Italic. Set the major/minor/micro tick lengths to
# 16/16/10 pixels pointing inwards, and their widths to 2/1/1 pixels.
m.setLabelStyle("Arial Italic", 16)
m.setTickLength(-16, -16, -10)
m.setLineWidth(0, 2, 1, 1)
# Demostrate different types of color scales and putting them at different positions
smoothColorScale = [0, 0x0000ff, 25, 0x0088ff, 50, 0x00ff00, 75, 0xdddd00, 100, 0xff0000]
stepColorScale = [0, 0x00aa00, 60, 0xddaa00, 80, 0xcc0000, 100]
highLowColorScale = [0, 0x00ff00, 70, Transparent, 100, 0xff0000]
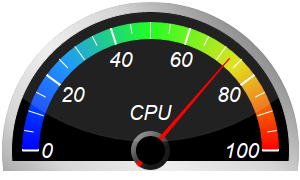
if chartIndex == 0 :
# Add the smooth color scale at the default position
m.addColorScale(smoothColorScale)
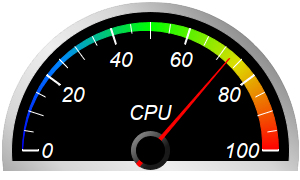
elif chartIndex == 1 :
# Add the smooth color scale starting at radius 128 with zero width and ending at radius 128
# with 16 pixels inner width
m.addColorScale(smoothColorScale, 128, 0, 128, -16)
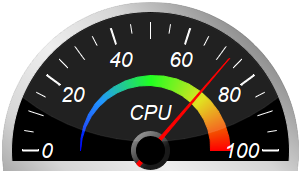
elif chartIndex == 2 :
# Add the smooth color scale starting at radius 70 with zero width and ending at radius 60
# with 20 pixels outer width
m.addColorScale(smoothColorScale, 70, 0, 60, 20)
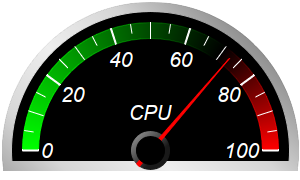
elif chartIndex == 3 :
# Add the high/low color scale at the default position
m.addColorScale(highLowColorScale)
elif chartIndex == 4 :
# Add the step color scale at the default position
m.addColorScale(stepColorScale)
else :
# Add the smooth color scale at radius 60 with 15 pixels outer width
m.addColorScale(smoothColorScale, 60, 15)
# Add a text label centered at (150, 125) with 15pt Arial Italic font
m.addText(150, 125, "CPU", "Arial Italic", 15, TextColor, BottomCenter)
# Add a red (0xff0000) pointer at the specified value
m.addPointer2(value, 0xff0000)
# Add glare up to radius 138 (= region inside border)
if chartIndex % 2 == 0 :
m.addGlare(138)
# Output the chart
m.makeChart("blacksemicirclemeter%s.png" % chartIndex)
createChart(0)
createChart(1)
createChart(2)
createChart(3)
createChart(4)
createChart(5)
© 2021 Advanced Software Engineering Limited. All rights reserved.