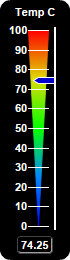
This example demonstrates vertical bar meters in a black coloring scheme.
ChartDirector 7.0 (Python Edition)
Black Vertical Linear Meters
Source Code Listing
#!/usr/bin/python
# The ChartDirector for Python module is assumed to be in "../lib"
import sys, os
sys.path.insert(0, os.path.join(os.path.abspath(sys.path[0]), "..", "lib"))
from pychartdir import *
def createChart(chartIndex) :
# The value to display on the meter
value = 74.25
# Create a LinearMeter object of size 70 x 260 pixels with black background and rounded corners
m = LinearMeter(70, 260, 0x000000)
m.setRoundedFrame(Transparent)
# Set the default text and line colors to white (0xffffff)
m.setColor(TextColor, 0xffffff)
m.setColor(LineColor, 0xffffff)
# Set the scale region top-left corner at (28, 30), with size of 20 x 196 pixels. The scale
# labels are located on the left (default - implies vertical meter)
m.setMeter(28, 30, 20, 196)
# Set meter scale from 0 - 100, with a tick every 10 units
m.setScale(0, 100, 10)
# The tick line width to 1 pixel
m.setLineWidth(0, 1)
# Demostrate different types of color scales and putting them at different positions
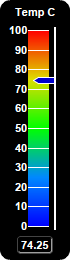
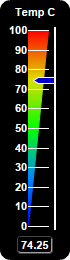
smoothColorScale = [0, 0x0000ff, 25, 0x0088ff, 50, 0x00ff00, 75, 0xdddd00, 100, 0xff0000]
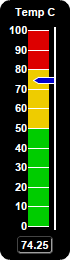
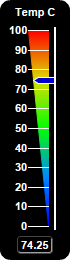
stepColorScale = [0, 0x00cc00, 50, 0xeecc00, 80, 0xdd0000, 100]
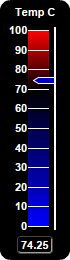
highLowColorScale = [0, 0x0000ff, 70, Transparent, 100, 0xff0000]
if chartIndex == 0 :
# Add the smooth color scale at the default position
m.addColorScale(smoothColorScale)
elif chartIndex == 1 :
# Add the step color scale at the default position
m.addColorScale(stepColorScale)
elif chartIndex == 2 :
# Add the high low scale at the default position
m.addColorScale(highLowColorScale)
elif chartIndex == 3 :
# Add the smooth color scale starting at x = 28 (left of scale) with zero width and ending
# at x = 28 with 20 pixels width
m.addColorScale(smoothColorScale, 28, 0, 28, 20)
elif chartIndex == 4 :
# Add the smooth color scale starting at x = 38 (center of scale) with zero width and ending
# at x = 28 with 20 pixels width
m.addColorScale(smoothColorScale, 38, 0, 28, 20)
else :
# Add the smooth color scale starting at x = 48 (right of scale) with zero width and ending
# at x = 28 with 20 pixels width
m.addColorScale(smoothColorScale, 48, 0, 28, 20)
# Add a blue (0x0000cc) pointer with white (0xffffff) border at the specified value
m.addPointer(value, 0x0000cc, 0xffffff)
# Add a label at the top-center using 8pt Arial Bold font
m.addText(m.getWidth() / 2, 5, "Temp C", "Arial Bold", 8, TextColor, Top)
# Add a text box at the bottom-center. Display the value using white (0xffffff) 8pt Arial Bold
# font on a black (0x000000) background with depressed grey (0x444444) rounded border.
t = m.addText(m.getWidth() / 2, m.getHeight() - 7, m.formatValue(value, "2"), "Arial Bold", 8,
0xffffff, Bottom)
t.setBackground(0x000000, 0x444444, -1)
t.setRoundedCorners(3)
# Output the chart
m.makeChart("blackvlinearmeter%s.png" % chartIndex)
createChart(0)
createChart(1)
createChart(2)
createChart(3)
createChart(4)
createChart(5)