pythondemo\circularbarmeter.py
#!/usr/bin/python
# The ChartDirector for Python module is assumed to be in "../lib"
import sys, os
sys.path.insert(0, os.path.join(os.path.abspath(sys.path[0]), "..", "lib"))
from pychartdir import *
def createChart(chartIndex) :
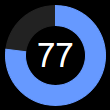
# The value to display on the meter
value = 77
# The meter radius and angle
radius = 50
angle = value * 360.0 / 100
# Create an AngularMeter with transparent background
m = AngularMeter(radius * 2 + 10, radius * 2 + 10, Transparent)
# Set the center, radius and angular range of the meter
m.setMeter(int(m.getWidth() / 2), int(m.getHeight() / 2), radius, 0, 360)
# For circular bar meters, we do not need pointer or graduation, so we hide them.
m.setMeterColors(Transparent, Transparent, Transparent)
m.setCap(0, Transparent)
#
# This example demonstrates several coloring styles
#
# Thd default fill and blank colors
fillColor = 0x6699ff
blankColor = 0xeeeeee
if chartIndex >= 4 :
# Use dark background style
m.setColors(whiteOnBlackPalette)
blankColor = 0x222222
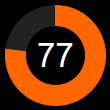
if chartIndex % 4 == 1 :
# Alternative fill color
fillColor = 0xff6600
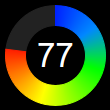
elif chartIndex % 4 == 2 :
# Use a smooth color scale as the fill color
smoothColorScale = [0, 0x0022ff, 15, 0x0088ff, 30, 0x00ff00, 55, 0xffff00, 80, 0xff0000,
100, 0xff0000]
fillColor = m.getDrawArea().angleGradientColor(int(m.getWidth() / 2), int(m.getHeight() / 2
), 0, 360, radius, radius - 20, smoothColorScale)
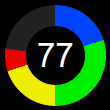
elif chartIndex % 4 == 3 :
# Use a step color scale as the fill color
stepColorScale = [0, 0x0044ff, 20, 0x00ee00, 50, 0xeeee00, 70, 0xee0000, 100]
fillColor = m.getDrawArea().angleGradientColor(int(m.getWidth() / 2), int(m.getHeight() / 2
), 0, 360, radius, radius - 20, stepColorScale)
# Draw the blank part of the circular bar
if angle < 360 :
m.addRingSector(radius, radius - 20, angle, 360, blankColor)
# Draw the fill part of the circular bar
if angle > 0 :
m.addRingSector(radius, radius - 20, 0, angle, fillColor)
# Add a label at the center to display the value
m.addText(int(m.getWidth() / 2), int(m.getHeight() / 2), m.formatValue(value, "{value}"),
"Arial", 25, TextColor, Center).setMargin(0)
# Output the chart
m.makeChart("circularbarmeter%s.png" % chartIndex)
createChart(0)
createChart(1)
createChart(2)
createChart(3)
createChart(4)
createChart(5)
createChart(6)
createChart(7)
© 2021 Advanced Software Engineering Limited. All rights reserved.