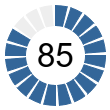
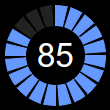
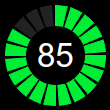
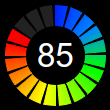
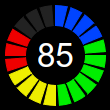
This example demonstrates circular bar meters in segmented style.
This example is similar to the Circular Bar Meter example except that the ring sectors are segmented.
ChartDirector 7.0 (Python Edition)
Circular Bar Meter (2)
Source Code Listing
#!/usr/bin/python
# The ChartDirector for Python module is assumed to be in "../lib"
import sys, os
sys.path.insert(0, os.path.join(os.path.abspath(sys.path[0]), "..", "lib"))
from pychartdir import *
def createChart(chartIndex) :
# The value to display on the meter
value = 85
# The meter radius and angle
radius = 50
angle = value * 360.0 / 100
# Create an AngularMeter with transparent background
m = AngularMeter(radius * 2 + 10, radius * 2 + 10, Transparent)
# Set the center, radius and angular range of the meter
m.setMeter(int(m.getWidth() / 2), int(m.getHeight() / 2), radius, 0, 360)
# For circular bar meters, we do not need pointer or graduation, so we hide them.
m.setMeterColors(Transparent, Transparent, Transparent)
m.setCap(0, Transparent)
# In this example, the circular bar has 20 segments
segmentCount = 20
# The angular step
angleStep = 360.0 / segmentCount
# The gap between segments is 4.5 degrees
angleGap = 4.5
#
# This example demonstrates several coloring styles
#
# Thd default fill and blank colors
fillColor = 0x336699
blankColor = 0xeeeeee
if chartIndex >= 4 :
# Use dark background style
m.setColors(whiteOnBlackPalette)
fillColor = 0x6699ff
blankColor = 0x222222
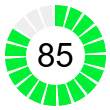
if chartIndex % 4 == 1 :
# Alternative fill color
fillColor = 0x00ee33
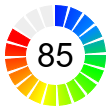
elif chartIndex % 4 == 2 :
# Use a smooth color scale as the fill color
smoothColorScale = [0, 0x0022ff, 15, 0x0088ff, 30, 0x00ff00, 55, 0xffff00, 80, 0xff0000,
100, 0xff0000]
fillColor = m.getDrawArea().angleGradientColor(int(m.getWidth() / 2), int(m.getHeight() / 2
), 0, 360, radius, radius - 20, smoothColorScale)
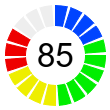
elif chartIndex % 4 == 3 :
# Use a step color scale as the fill color
stepColorScale = [0, 0x0044ff, 20, 0x00ee00, 50, 0xeeee00, 70, 0xee0000, 100]
fillColor = m.getDrawArea().angleGradientColor(int(m.getWidth() / 2), int(m.getHeight() / 2
), - angleGap / 2, 360 - angleGap / 2, radius, radius - 20, stepColorScale)
#
# Now we draw the segments of the bar meter
#
# The segment that contains the value
currentSegment = int(angle / angleStep)
# Segments after the current segment is colored with the blank color
for i in range(currentSegment + 1, segmentCount) :
m.addRingSector(radius, radius - 20, i * angleStep, (i + 1) * angleStep - angleGap,
blankColor)
# Segments before the current segment is colored with the fill color
for i in range(0, currentSegment) :
m.addRingSector(radius, radius - 20, i * angleStep, (i + 1) * angleStep - angleGap,
fillColor)
# Segment that contains the angle will be partially filled and partially blank. We need to
# adjust the angle to compensated for the angle gap.
adjustedAngle = currentSegment * angleStep + (angle - currentSegment * angleStep) * (
1 - angleGap / angleStep)
# The blank part of the segment
if (currentSegment + 1) * angleStep > angle :
m.addRingSector(radius, radius - 20, adjustedAngle, (currentSegment + 1
) * angleStep - angleGap, blankColor)
# The filled part of the segment.
if angle > currentSegment * angleStep :
m.addRingSector(radius, radius - 20, currentSegment * angleStep, adjustedAngle, fillColor)
# Add a label at the center to display the value
m.addText(int(m.getWidth() / 2), int(m.getHeight() / 2), m.formatValue(value, "{value}"),
"Arial", 25, TextColor, Center).setMargin(0)
# Output the chart
m.makeChart("circularbarmeter2%s.png" % chartIndex)
createChart(0)
createChart(1)
createChart(2)
createChart(3)
createChart(4)
createChart(5)
createChart(6)
createChart(7)