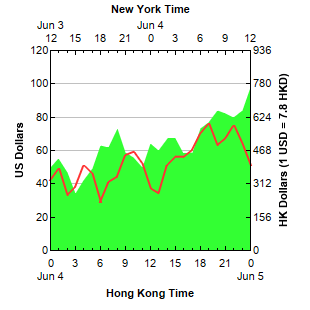
This example demonstrates a chart with two x-axes and two y-axes.
ChartDirector supports arbitrary number of axes. The first two x and y axes are most commonly used and can be retrieved using
XYChart.xAxis,
XYChart.xAxis2,
XYChart.yAxis and
XYChart.yAxis2. These axes are by default positioned at the edges of the plot area.
The key features demonstrated in this example are:
pythondemo\dualxaxis.py
#!/usr/bin/python

# The ChartDirector for Python module is assumed to be in "../lib"
import sys, os
sys.path.insert(0, os.path.join(os.path.abspath(sys.path[0]), "..", "lib"))

from pychartdir import *

# The data for the chart
data0 = [42, 49, 33, 38, 51, 46, 29, 41, 44, 57, 59, 52, 37, 34, 51, 56, 56, 60, 70, 76, 63, 67, 75,
    64, 51]
data1 = [50, 55, 47, 34, 42, 49, 63, 62, 73, 59, 56, 50, 64, 60, 67, 67, 58, 59, 73, 77, 84, 82, 80,
    84, 98]

# The labels for the bottom x axis. Note the "-" means a minor tick.
labels0 = ["0\nJun 4", "1", "2", "3", "4", "5", "6", "7", "8", "9", "10", "11", "12", "13", "14",
    "15", "16", "17", "18", "19", "20", "21", "22", "23", "0\nJun 5"]

# The labels for the top x axis. Note that "-" means a minor tick.
labels1 = ["Jun 3\n12", "13", "14", "15", "16", "17", "18", "19", "20", "21", "22", "23",
    "Jun 4\n0", "1", "2", "3", "4", "5", "6", "7", "8", "9", "10", "11", "12"]

# Create a XYChart object of size 310 x 310 pixels
c = XYChart(310, 310)

# Set the plotarea at (50, 50) and of size 200 x 200 pixels
c.setPlotArea(50, 50, 200, 200)

# Add a title to the primary (left) y axis
c.yAxis().setTitle("US Dollars")

# Set the tick length to -4 pixels (-ve means ticks inside the plot area)
c.yAxis().setTickLength(-4)

# Add a title to the secondary (right) y axis
c.yAxis2().setTitle("HK Dollars (1 USD = 7.8 HKD)")

# Set the tick length to -4 pixels (-ve means ticks inside the plot area)
c.yAxis2().setTickLength(-4)

# Synchronize the y-axis such that y2 = 7.8 x y1
c.syncYAxis(7.8)

# Add a title to the bottom x axis
c.xAxis().setTitle("Hong Kong Time")

# Set the labels on the x axis.
c.xAxis().setLabels(labels0)

# Display 1 out of 3 labels on the x-axis. Show minor ticks for remaining labels.
c.xAxis().setLabelStep(3, 1)

# Set the major tick length to -4 pixels and minor tick length to -2 pixels (-ve means ticks inside
# the plot area)
c.xAxis().setTickLength2(-4, -2)

# Set the distance between the axis labels and the axis to 6 pixels
c.xAxis().setLabelGap(6)

# Add a title to the top x-axis
c.xAxis2().setTitle("New York Time")

# Set the labels on the x axis.
c.xAxis2().setLabels(labels1)

# Display 1 out of 3 labels on the x-axis. Show minor ticks for remaining labels.
c.xAxis2().setLabelStep(3, 1)

# Set the major tick length to -4 pixels and minor tick length to -2 pixels (-ve means ticks inside
# the plot area)
c.xAxis2().setTickLength2(-4, -2)

# Set the distance between the axis labels and the axis to 6 pixels
c.xAxis2().setLabelGap(6)

# Add a line layer to the chart with a line width of 2 pixels
c.addLineLayer(data0, -1, "Red Transactions").setLineWidth(2)

# Add an area layer to the chart with no area boundary line
c.addAreaLayer(data1, -1, "Green Transactions").setLineWidth(0)

# Output the chart
c.makeChart("dualxaxis.png")
© 2021 Advanced Software Engineering Limited. All rights reserved.