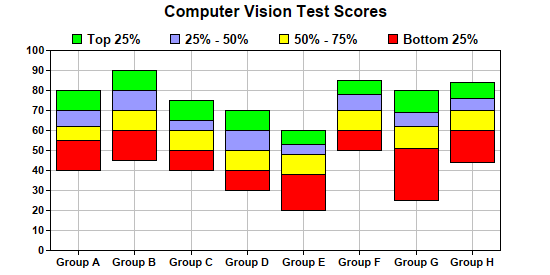
This example demonstrates creating a multi-color floating box chart.
This chart is composed of 4 box-whisker layers, created using
XYChart.addBoxWhiskerLayer. Each layer handles boxes of one color. Only the "box" part of the box-whisker layer is used.
pythondemo\floatingbox.py
#!/usr/bin/python

# The ChartDirector for Python module is assumed to be in "../lib"
import sys, os
sys.path.insert(0, os.path.join(os.path.abspath(sys.path[0]), "..", "lib"))

from pychartdir import *

# Sample data for the Box-Whisker chart. Represents the minimum, 1st quartile, medium, 3rd quartile
# and maximum values of some quantities
Q0Data = [40, 45, 40, 30, 20, 50, 25, 44]
Q1Data = [55, 60, 50, 40, 38, 60, 51, 60]
Q2Data = [62, 70, 60, 50, 48, 70, 62, 70]
Q3Data = [70, 80, 65, 60, 53, 78, 69, 76]
Q4Data = [80, 90, 75, 70, 60, 85, 80, 84]

# The labels for the chart
labels = ["Group A", "Group B", "Group C", "Group D", "Group E", "Group F", "Group G", "Group H"]

# Create a XYChart object of size 550 x 250 pixels
c = XYChart(550, 275)

# Set the plotarea at (50, 25) and of size 450 x 200 pixels. Enable both horizontal and vertical
# grids by setting their colors to grey (0xc0c0c0)
c.setPlotArea(50, 50, 450, 200).setGridColor(0xc0c0c0, 0xc0c0c0)

# Add a title to the chart
c.addTitle("Computer Vision Test Scores")

# Set the labels on the x axis and the font to Arial Bold
c.xAxis().setLabels(labels).setFontStyle("Arial Bold")

# Set the font for the y axis labels to Arial Bold
c.yAxis().setLabelStyle("Arial Bold")

# Add a Box Whisker layer using light blue 0x9999ff as the fill color and blue (0xcc) as the line
# color. Set the line width to 2 pixels
c.addBoxLayer(Q4Data, Q3Data, 0x00ff00, "Top 25%")
c.addBoxLayer(Q3Data, Q2Data, 0x9999ff, "25% - 50%")
c.addBoxLayer(Q2Data, Q1Data, 0xffff00, "50% - 75%")
c.addBoxLayer(Q1Data, Q0Data, 0xff0000, "Bottom 25%")

# Add legend box at top center above the plot area using 10pt Arial Bold Font
b = c.addLegend(50 + 225, 22, 0, "Arial Bold", 10)
b.setAlignment(TopCenter)
b.setBackground(Transparent)

# Output the chart
c.makeChart("floatingbox.png")
© 2021 Advanced Software Engineering Limited. All rights reserved.