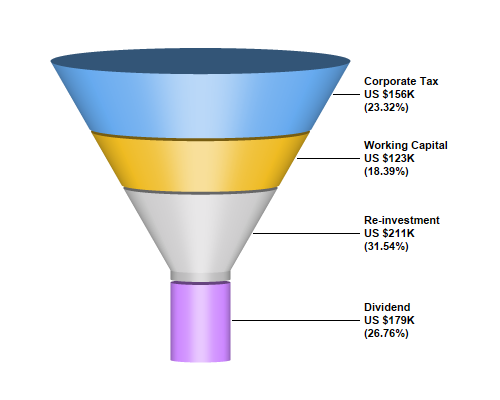
This example demonstrates using PyramidChart.setFunnelSize to specify using a funnel instead of a pyramid to represent the data.
ChartDirector 7.0 (Python Edition)
Funnel Chart
Source Code Listing
#!/usr/bin/python

# The ChartDirector for Python module is assumed to be in "../lib"
import sys, os
sys.path.insert(0, os.path.join(os.path.abspath(sys.path[0]), "..", "lib"))

from pychartdir import *

# The data for the pyramid chart
data = [156, 123, 211, 179]

# The labels for the pyramid chart
labels = ["Corporate Tax", "Working Capital", "Re-investment", "Dividend"]

# The colors for the pyramid layers
colors = [0x66aaee, 0xeebb22, 0xcccccc, 0xcc88ff]

# Create a PyramidChart object of size 500 x 400 pixels
c = PyramidChart(500, 400)

# Set the funnel center at (200, 210), and width x height to 150 x 300 pixels
c.setFunnelSize(200, 210, 150, 300)

# Set the elevation to 5 degrees
c.setViewAngle(5)

# Set the pyramid data and labels
c.setData(data, labels)

# Set the layer colors to the given colors
c.setColors2(DataColor, colors)

# Leave 1% gaps between layers
c.setLayerGap(0.01)

# Add labels at the right side of the pyramid layers using Arial Bold font. The labels will have 3
# lines showing the layer name, value and percentage.
c.setRightLabel("{label}\nUS ${value}K\n({percent}%)", "Arial Bold")

# Output the chart
c.makeChart("funnel.png")