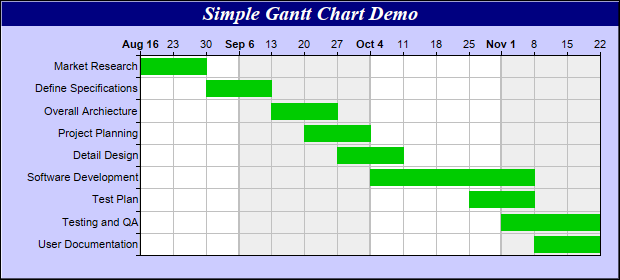
This example demonstrates a simple gantt chart.
This chart is created by using a horizontal box-whisker layer, in which only the "box" part of the box-whisker layer is used. Date/time values are used as box data, resulting in a gantt chart.
The key features demonstrated in this example are:
- Create the box-whisker layer using XYChart.addBoxWhiskerLayer, in which the data arrays are dates.
- Swap the x-axis and y-axis using XYChart.swapXY, so the chart is using a horizontal orientation.
- Use XYChart.setYAxisOnRight to move the y-axis to the opposite side of the plot area, so that the y-axis is at the top of the plot area. (Note: the "right" word on setYAxisOnRight means the "right" side before "swapXY" rotation. After rotation, the right side will become to top side.)
- Use Axis.setReverse to reverse the direction of the x-axis, so that the x-axis is vertical from top to bottom (instead of from bottom to top).
- Set the y-axis to date scale using Axis.setDateScale.
- Set multi-format axis labels for the y-axis using Axis.setMultiFormat. Note that the labels for the first week of the month are in bold, with the month name shown. The other labels just show the day.
- Use alternative background colors for the plot area by providing two background colors when calling XYChart.setPlotArea.
pythondemo\gantt.py
#!/usr/bin/python

# The ChartDirector for Python module is assumed to be in "../lib"
import sys, os
sys.path.insert(0, os.path.join(os.path.abspath(sys.path[0]), "..", "lib"))

from pychartdir import *

# data for the gantt chart, representing the start date, end date and names for various activities
startDate = [chartTime(2004, 8, 16), chartTime(2004, 8, 30), chartTime(2004, 9, 13), chartTime(2004,
    9, 20), chartTime(2004, 9, 27), chartTime(2004, 10, 4), chartTime(2004, 10, 25), chartTime(2004,
    11, 1), chartTime(2004, 11, 8)]
endDate = [chartTime(2004, 8, 30), chartTime(2004, 9, 13), chartTime(2004, 9, 27), chartTime(2004,
    10, 4), chartTime(2004, 10, 11), chartTime(2004, 11, 8), chartTime(2004, 11, 8), chartTime(2004,
    11, 22), chartTime(2004, 11, 22)]
labels = ["Market Research", "Define Specifications", "Overall Archiecture", "Project Planning",
    "Detail Design", "Software Development", "Test Plan", "Testing and QA", "User Documentation"]

# Create a XYChart object of size 620 x 280 pixels. Set background color to light blue (ccccff),
# with 1 pixel 3D border effect.
c = XYChart(620, 280, 0xccccff, 0x000000, 1)

# Add a title to the chart using 15 points Times Bold Itatic font, with white (ffffff) text on a
# deep blue (000080) background
c.addTitle("Simple Gantt Chart Demo", "Times New Roman Bold Italic", 15, 0xffffff).setBackground(
    0x000080)

# Set the plotarea at (140, 55) and of size 460 x 200 pixels. Use alternative white/grey background.
# Enable both horizontal and vertical grids by setting their colors to grey (c0c0c0). Set vertical
# major grid (represents month boundaries) 2 pixels in width
c.setPlotArea(140, 55, 460, 200, 0xffffff, 0xeeeeee, LineColor, 0xc0c0c0, 0xc0c0c0).setGridWidth(2,
    1, 1, 1)

# swap the x and y axes to create a horziontal box-whisker chart
c.swapXY()

# Set the y-axis scale to be date scale from Aug 16, 2004 to Nov 22, 2004, with ticks every 7 days
# (1 week)
c.yAxis().setDateScale(chartTime(2004, 8, 16), chartTime(2004, 11, 22), 86400 * 7)

# Set multi-style axis label formatting. Month labels are in Arial Bold font in "mmm d" format.
# Weekly labels just show the day of month and use minor tick (by using '-' as first character of
# format string).
c.yAxis().setMultiFormat(StartOfMonthFilter(), "<*font=Arial Bold*>{value|mmm d}", StartOfDayFilter(
    ), "-{value|d}")

# Set the y-axis to shown on the top (right + swapXY = top)
c.setYAxisOnRight()

# Set the labels on the x axis
c.xAxis().setLabels(labels)

# Reverse the x-axis scale so that it points downwards.
c.xAxis().setReverse()

# Set the horizontal ticks and grid lines to be between the bars
c.xAxis().setTickOffset(0.5)

# Add a green (33ff33) box-whisker layer showing the box only.
c.addBoxWhiskerLayer(startDate, endDate, None, None, None, 0x00cc00, SameAsMainColor,
    SameAsMainColor)

# Output the chart
c.makeChart("gantt.png")
© 2021 Advanced Software Engineering Limited. All rights reserved.