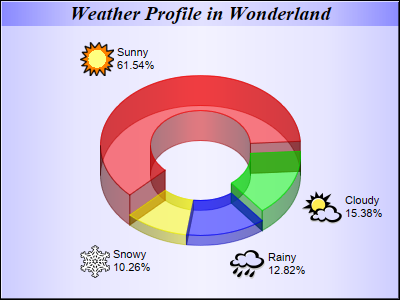
This example modifies the
Icon Pie Chart example by using a semi-transparent donut instead of a pie, and using metallic background color.
pythondemo\icondonut.py
#!/usr/bin/python

# The ChartDirector for Python module is assumed to be in "../lib"
import sys, os
sys.path.insert(0, os.path.join(os.path.abspath(sys.path[0]), "..", "lib"))

from pychartdir import *

# The data for the pie chart
data = [72, 18, 15, 12]

# The depths for the sectors
depths = [30, 20, 10, 10]

# The labels for the pie chart
labels = ["Sunny", "Cloudy", "Rainy", "Snowy"]

# The icons for the sectors
icons = ["sun.png", "cloud.png", "rain.png", "snowy.png"]

# Create a PieChart object of size 400 x 300 pixels
c = PieChart(400, 300)

# Use the semi-transparent palette for this chart
c.setColors(transparentPalette)

# Set the background to metallic light blue (CCFFFF), with a black border and 1 pixel 3D border
# effect,
c.setBackground(metalColor(0xccccff), 0x000000, 1)

# Set donut center at (200, 175), and outer/inner radii as 100/50 pixels
c.setDonutSize(200, 175, 100, 50)

# Add a title box using 15pt Times Bold Italic font and metallic blue (8888FF) background color
c.addTitle("Weather Profile in Wonderland", "Times New Roman Bold Italic", 15).setBackground(
    metalColor(0x8888ff))

# Set the pie data and the pie labels
c.setData(data, labels)

# Add icons to the chart as a custom field
c.addExtraField(icons)

# Configure the sector labels using CDML to include the icon images
c.setLabelFormat("<*block,valign=absmiddle*><*img={field0}*> <*block*>{label}\n{percent}%<*/*><*/*>"
    )

# Draw the pie in 3D with variable 3D depths
c.set3D2(depths)

# Set the start angle to 225 degrees may improve layout when the depths of the sector are sorted in
# descending order, because it ensures the tallest sector is at the back.
c.setStartAngle(225)

# Output the chart
c.makeChart("icondonut.png")
© 2021 Advanced Software Engineering Limited. All rights reserved.