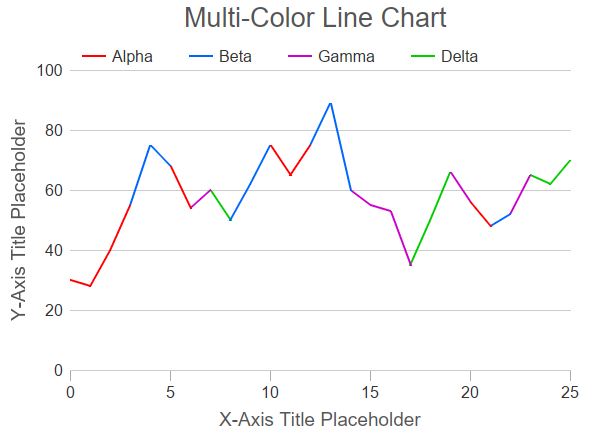
This example demonstrates a line chart with line segments of different colors.
In this example, each line segment has a type specified in the pointType array. Note that with N data points, there will only be (N - 1) line segments. So the pointType array size is one less than the data point array size.
A loop is used to separate the line segments by type into different line layers, The line layers are configured with different colors and names. This generates the multi-color line and the legend entries.
pythondemo\multicolorline.py
#!/usr/bin/python

# The ChartDirector for Python module is assumed to be in "../lib"
import sys, os
sys.path.insert(0, os.path.join(os.path.abspath(sys.path[0]), "..", "lib"))

from pychartdir import *

# Data points for the line chart
dataX = [0, 1, 2, 3, 4, 5, 6, 7, 8, 9, 10, 11, 12, 13, 14, 15, 16, 17, 18, 19, 20, 21, 22, 23, 24,
    25]
dataY = [30, 28, 40, 55, 75, 68, 54, 60, 50, 62, 75, 65, 75, 89, 60, 55, 53, 35, 50, 66, 56, 48, 52,
    65, 62, 70]

# The data point type. The color of the line segment will be based on the starting point type of the
# segment. In this example, we have 4 point types for 4 different colors. Note that for a line with
# N points, there will be (N - 1) line segments, so we only need (N - 1) values in the point type
# array.
pointType = [0, 0, 0, 1, 1, 0, 2, 3, 1, 1, 0, 0, 1, 1, 2, 2, 2, 3, 3, 2, 0, 1, 2, 3, 3]
colors = [0xff0000, 0x0066ff, 0xcc00cc, 0x00cc00]
pointTypeLabels = ["Alpha", "Beta", "Gamma", "Delta"]

# Create a XYChart object of size 600 x 430 pixels
c = XYChart(600, 430)

# Set default text color to dark grey (0x333333)
c.setColor(TextColor, 0x333333)

# Add a title box using grey (0x555555) 20pt Arial font
c.addTitle("    Multi-Color Line Chart", "Arial", 20, 0x555555)

# Set the plotarea at (70, 70) and of size 500 x 300 pixels, with transparent background and border
# and light grey (0xcccccc) horizontal grid lines
c.setPlotArea(70, 70, 500, 300, Transparent, -1, Transparent, 0xcccccc)

# Add a legend box with horizontal layout above the plot area at (70, 35). Use 12pt Arial font,
# transparent background and border, and line style legend icon.
b = c.addLegend(70, 35, 0, "Arial", 12)
b.setBackground(Transparent, Transparent)
b.setLineStyleKey()

# Set axis label font to 12pt Arial
c.xAxis().setLabelStyle("Arial", 12)
c.yAxis().setLabelStyle("Arial", 12)

# Set the x and y axis stems to transparent, and the x-axis tick color to grey (0xaaaaaa)
c.xAxis().setColors(Transparent, TextColor, TextColor, 0xaaaaaa)
c.yAxis().setColors(Transparent)

# Set the major/minor tick lengths for the x-axis to 10 and 0.
c.xAxis().setTickLength(10, 0)

# For the automatic axis labels, set the minimum spacing to 80/40 pixels for the x/y axis.
c.xAxis().setTickDensity(80)
c.yAxis().setTickDensity(40)

# Add a title to the y axis using dark grey (0x555555) 14pt Arial font
c.xAxis().setTitle("X-Axis Title Placeholder", "Arial", 14, 0x555555)
c.yAxis().setTitle("Y-Axis Title Placeholder", "Arial", 14, 0x555555)

# In ChartDirector, each line layer can only have one line color, so we use 4 line layers to draw
# the 4 different colors of line segments.

# In general, the line segments for each color will not be continuous. In ChartDirector,
# non-continuous line segments can be achieved by inserting NoValue points. To allow for these extra
# points, we use a buffer twice the size of the original data arrays.
lineX = [0] * (len(dataX) * 2)
lineY = [0] * (len(dataY) * 2)

# Use a loop to create a line layer for each color
for i in range(0, len(colors)) :
    n = 0
    for j in range(0, len(dataX)) :
        # We include data points of the target type in the line layer.
        if (j < len(pointType)) and (pointType[j] == i) :
            lineX[n] = dataX[j]
            lineY[n] = dataY[j]
            n = n + 1
        elif (j > 0) and (pointType[j - 1] == i) :
            # If the current point is not of the target, but the previous point is of the target
            # type, we still need to include the current point in the line layer, as it takes two
            # points to draw a line segment. We also need an extra NoValue point so that the current
            # point will not join with the next point.
            lineX[n] = dataX[j]
            lineY[n] = dataY[j]
            n = n + 1
            lineX[n] = dataX[j]
            lineY[n] = NoValue
            n = n + 1
    # Draw the layer that contains all segments of the target color
    layer = c.addLineLayer(lineY[0:n], colors[i], pointTypeLabels[i])
    layer.setXData(lineX[0:n])
    layer.setLineWidth(2)

# Output the chart
c.makeChart("multicolorline.png")
© 2021 Advanced Software Engineering Limited. All rights reserved.