This example demonstrates a 3D pie chart where sectors have different 3D heights.
Instead of using
PieChart.set3D to set a single 3D depth for all sectors, in this example,
PieChart.set3D2 is used to set different depths for the sectors with an array of integers.
pythondemo\multidepthpie.py
#!/usr/bin/python
# The ChartDirector for Python module is assumed to be in "../lib"
import sys, os
sys.path.insert(0, os.path.join(os.path.abspath(sys.path[0]), "..", "lib"))
from pychartdir import *
# The data for the pie chart
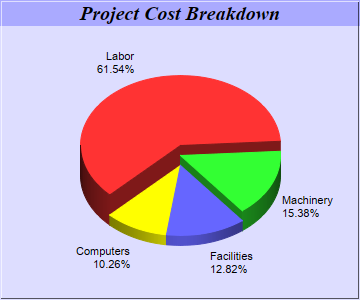
data = [72, 18, 15, 12]
# The labels for the pie chart
labels = ["Labor", "Machinery", "Facilities", "Computers"]
# The depths for the sectors
depths = [30, 20, 10, 10]
# Create a PieChart object of size 360 x 300 pixels, with a light blue (DDDDFF) background and a 1
# pixel 3D border
c = PieChart(360, 300, 0xddddff, -1, 1)
# Set the center of the pie at (180, 175) and the radius to 100 pixels
c.setPieSize(180, 175, 100)
# Add a title box using 15pt Times Bold Italic font and blue (AAAAFF) as background color
c.addTitle("Project Cost Breakdown", "Times New Roman Bold Italic", 15).setBackground(0xaaaaff)
# Set the pie data and the pie labels
c.setData(data, labels)
# Draw the pie in 3D with variable 3D depths
c.set3D2(depths)
# Set the start angle to 225 degrees may improve layout when the depths of the sector are sorted in
# descending order, because it ensures the tallest sector is at the back.
c.setStartAngle(225)
# Output the chart
c.makeChart("multidepthpie.png")
© 2021 Advanced Software Engineering Limited. All rights reserved.