pythondemo\multipie.py
#!/usr/bin/python
# The ChartDirector for Python module is assumed to be in "../lib"
import sys, os
sys.path.insert(0, os.path.join(os.path.abspath(sys.path[0]), "..", "lib"))
from pychartdir import *
def createChart(chartIndex) :
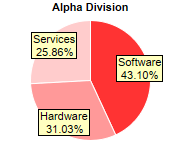
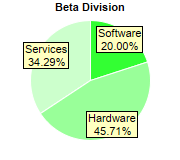
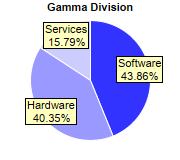
# The data for the pie chart
data0 = [25, 18, 15]
data1 = [14, 32, 24]
data2 = [25, 23, 9]
# The labels for the pie chart
labels = ["Software", "Hardware", "Services"]
# Create a PieChart object of size 180 x 160 pixels
c = PieChart(180, 160)
# Set the center of the pie at (90, 80) and the radius to 60 pixels
c.setPieSize(90, 80, 60)
# Set the border color of the sectors to white (ffffff)
c.setLineColor(0xffffff)
# Set the background color of the sector label to pale yellow (ffffc0) with a black border
# (000000)
c.setLabelStyle().setBackground(0xffffc0, 0x000000)
# Set the label to be slightly inside the perimeter of the circle
c.setLabelLayout(CircleLayout, -10)
# Set the title, data and colors according to which pie to draw
if chartIndex == 0 :
c.addTitle("Alpha Division", "Arial Bold", 8)
c.setData(data0, labels)
colors0 = [0xff3333, 0xff9999, 0xffcccc]
c.setColors2(DataColor, colors0)
elif chartIndex == 1 :
c.addTitle("Beta Division", "Arial Bold", 8)
c.setData(data1, labels)
colors1 = [0x33ff33, 0x99ff99, 0xccffcc]
c.setColors2(DataColor, colors1)
else :
c.addTitle("Gamma Division", "Arial Bold", 8)
c.setData(data2, labels)
colors2 = [0x3333ff, 0x9999ff, 0xccccff]
c.setColors2(DataColor, colors2)
# Output the chart
c.makeChart("multipie%s.png" % chartIndex)
createChart(0)
createChart(1)
createChart(2)
© 2021 Advanced Software Engineering Limited. All rights reserved.