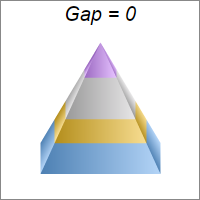


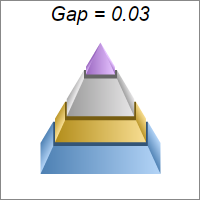
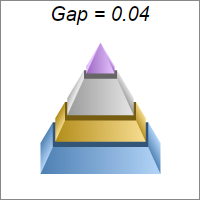
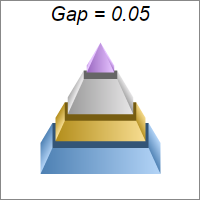
This example demonstrates the effects of different pyramid layer gap sizes, configured with PyramidChart.setLayerGap.
ChartDirector 7.0 (Python Edition)
Pyramid Gap
Source Code Listing
#!/usr/bin/python

# The ChartDirector for Python module is assumed to be in "../lib"
import sys, os
sys.path.insert(0, os.path.join(os.path.abspath(sys.path[0]), "..", "lib"))

from pychartdir import *

def createChart(chartIndex) :

    # The data for the pyramid chart
    data = [156, 123, 211, 179]

    # The colors for the pyramid layers
    colors = [0x66aaee, 0xeebb22, 0xcccccc, 0xcc88ff]

    # The layer gap
    gap = chartIndex * 0.01

    # Create a PyramidChart object of size 200 x 200 pixels, with white (ffffff) background and grey
    # (888888) border
    c = PyramidChart(200, 200, 0xffffff, 0x888888)

    # Set the pyramid center at (100, 100), and width x height to 60 x 120 pixels
    c.setPyramidSize(100, 100, 60, 120)

    # Set the layer gap
    c.addTitle("Gap = %s" % (gap), "Arial Italic", 15)
    c.setLayerGap(gap)

    # Set the elevation to 15 degrees
    c.setViewAngle(15)

    # Set the pyramid data
    c.setData(data)

    # Set the layer colors to the given colors
    c.setColors2(DataColor, colors)

    # Output the chart
    c.makeChart("pyramidgap%s.png" % chartIndex)


createChart(0)
createChart(1)
createChart(2)
createChart(3)
createChart(4)
createChart(5)