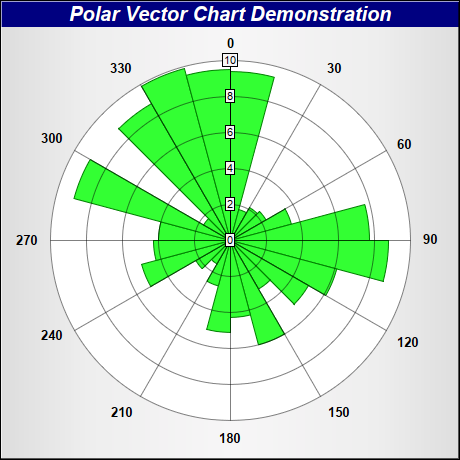
This example demonstrates how to create a rose chart.
A rose chart is basically a polar chart with sectors of variable radius. This can be achieved by creating a
PolarChart object as the graph paper, and adding sector zones on it using
AngularAxis.addZone.
To enable auto-scale of the axis, in this example, we also add the radius data to a transparent line layer using
PolarChart.addLineLayer. The line layer has no visible effect, but it causes the radial axis to auto-scale so that it covers the radius data.
pythondemo\rose.py
#!/usr/bin/python

# The ChartDirector for Python module is assumed to be in "../lib"
import sys, os
sys.path.insert(0, os.path.join(os.path.abspath(sys.path[0]), "..", "lib"))

from pychartdir import *

# Data for the chart
data = [9.4, 1.8, 2.1, 2.3, 3.5, 7.7, 8.8, 6.1, 5.0, 3.1, 6.0, 4.3, 5.1, 2.6, 1.5, 2.2, 5.1, 4.3,
    4.0, 9.0, 1.7, 8.8, 9.9, 9.5]
angles = [0, 15, 30, 45, 60, 75, 90, 105, 120, 135, 150, 165, 180, 195, 210, 225, 240, 255, 270,
    285, 300, 315, 330, 345]

# Create a PolarChart object of size 460 x 460 pixels, with a silver background and a 1 pixel 3D
# border
c = PolarChart(460, 460, silverColor(), 0x000000, 1)

# Add a title to the chart at the top left corner using 15pt Arial Bold Italic font. Use white text
# on deep blue background.
c.addTitle("Polar Vector Chart Demonstration", "Arial Bold Italic", 15, 0xffffff).setBackground(
    0x000080)

# Set plot area center at (230, 240) with radius 180 pixels and white background
c.setPlotArea(230, 240, 180, 0xffffff)

# Set the grid style to circular grid
c.setGridStyle(0)

# Set angular axis as 0 - 360, with a spoke every 30 units
c.angularAxis().setLinearScale(0, 360, 30)

# Add sectors to the chart as sector zones
for i in range(0, len(data)) :
    c.angularAxis().addZone(angles[i], angles[i] + 15, 0, data[i], 0x33ff33, 0x008000)

# Add an Transparent invisible layer to ensure the axis is auto-scaled using the data
c.addLineLayer(data, Transparent)

# Output the chart
c.makeChart("rose.png")
© 2021 Advanced Software Engineering Limited. All rights reserved.